I returned from maternity leave in June 2019 excited to get stuck into the final phase of data entry, processing, analysis and moving on to writing everything up. My interactions with people working across post-medieval archaeology and industrial archaeology provided yet another opportunity in the form of co-chairing a session at the Theoretical Archaeology Group (TAG) conference at University College, London (UCL) in December 2019. The session was co-chaired with Mike Nevell and Hilary Orange, and was titled ‘Investigating industrial pasts and legacies from multi-and interdisciplinary perspectives‘. The session was excellent, with UK based and international speakers discussing a range of ways in which industrial archaeology can, and should, be using interdisciplinary approaches. The session and topic is something close to my heart, as I’ve always managed to find myself straddling disciplines or approaches, not always intentionally. My PhD research sits comfortably across the disciplines of archaeology and history, but also across historical geography and digital humanities. The approaches I use include aspects of methods common in maritime, historical and industrial archaeology, but not all at the same time. The session at TAG offered an opportunity to present a more updated version of my methodology than appeared in the PIA paper in 2013, and some of the results of the archaeological fieldwork.
What follows are the slides and some accompanying notes from the TAG presentation.
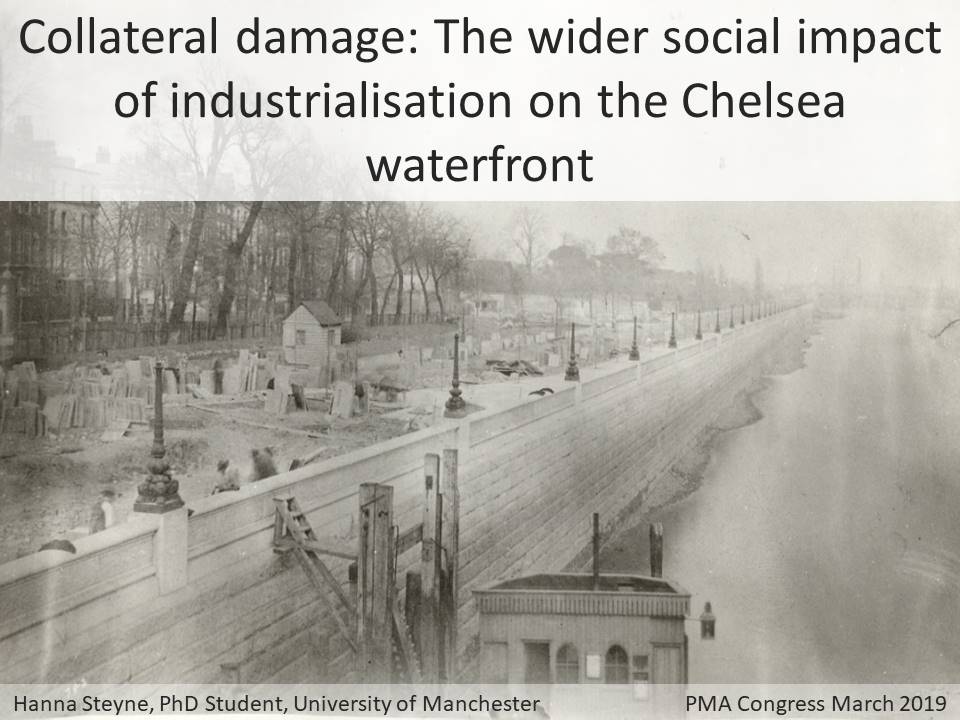
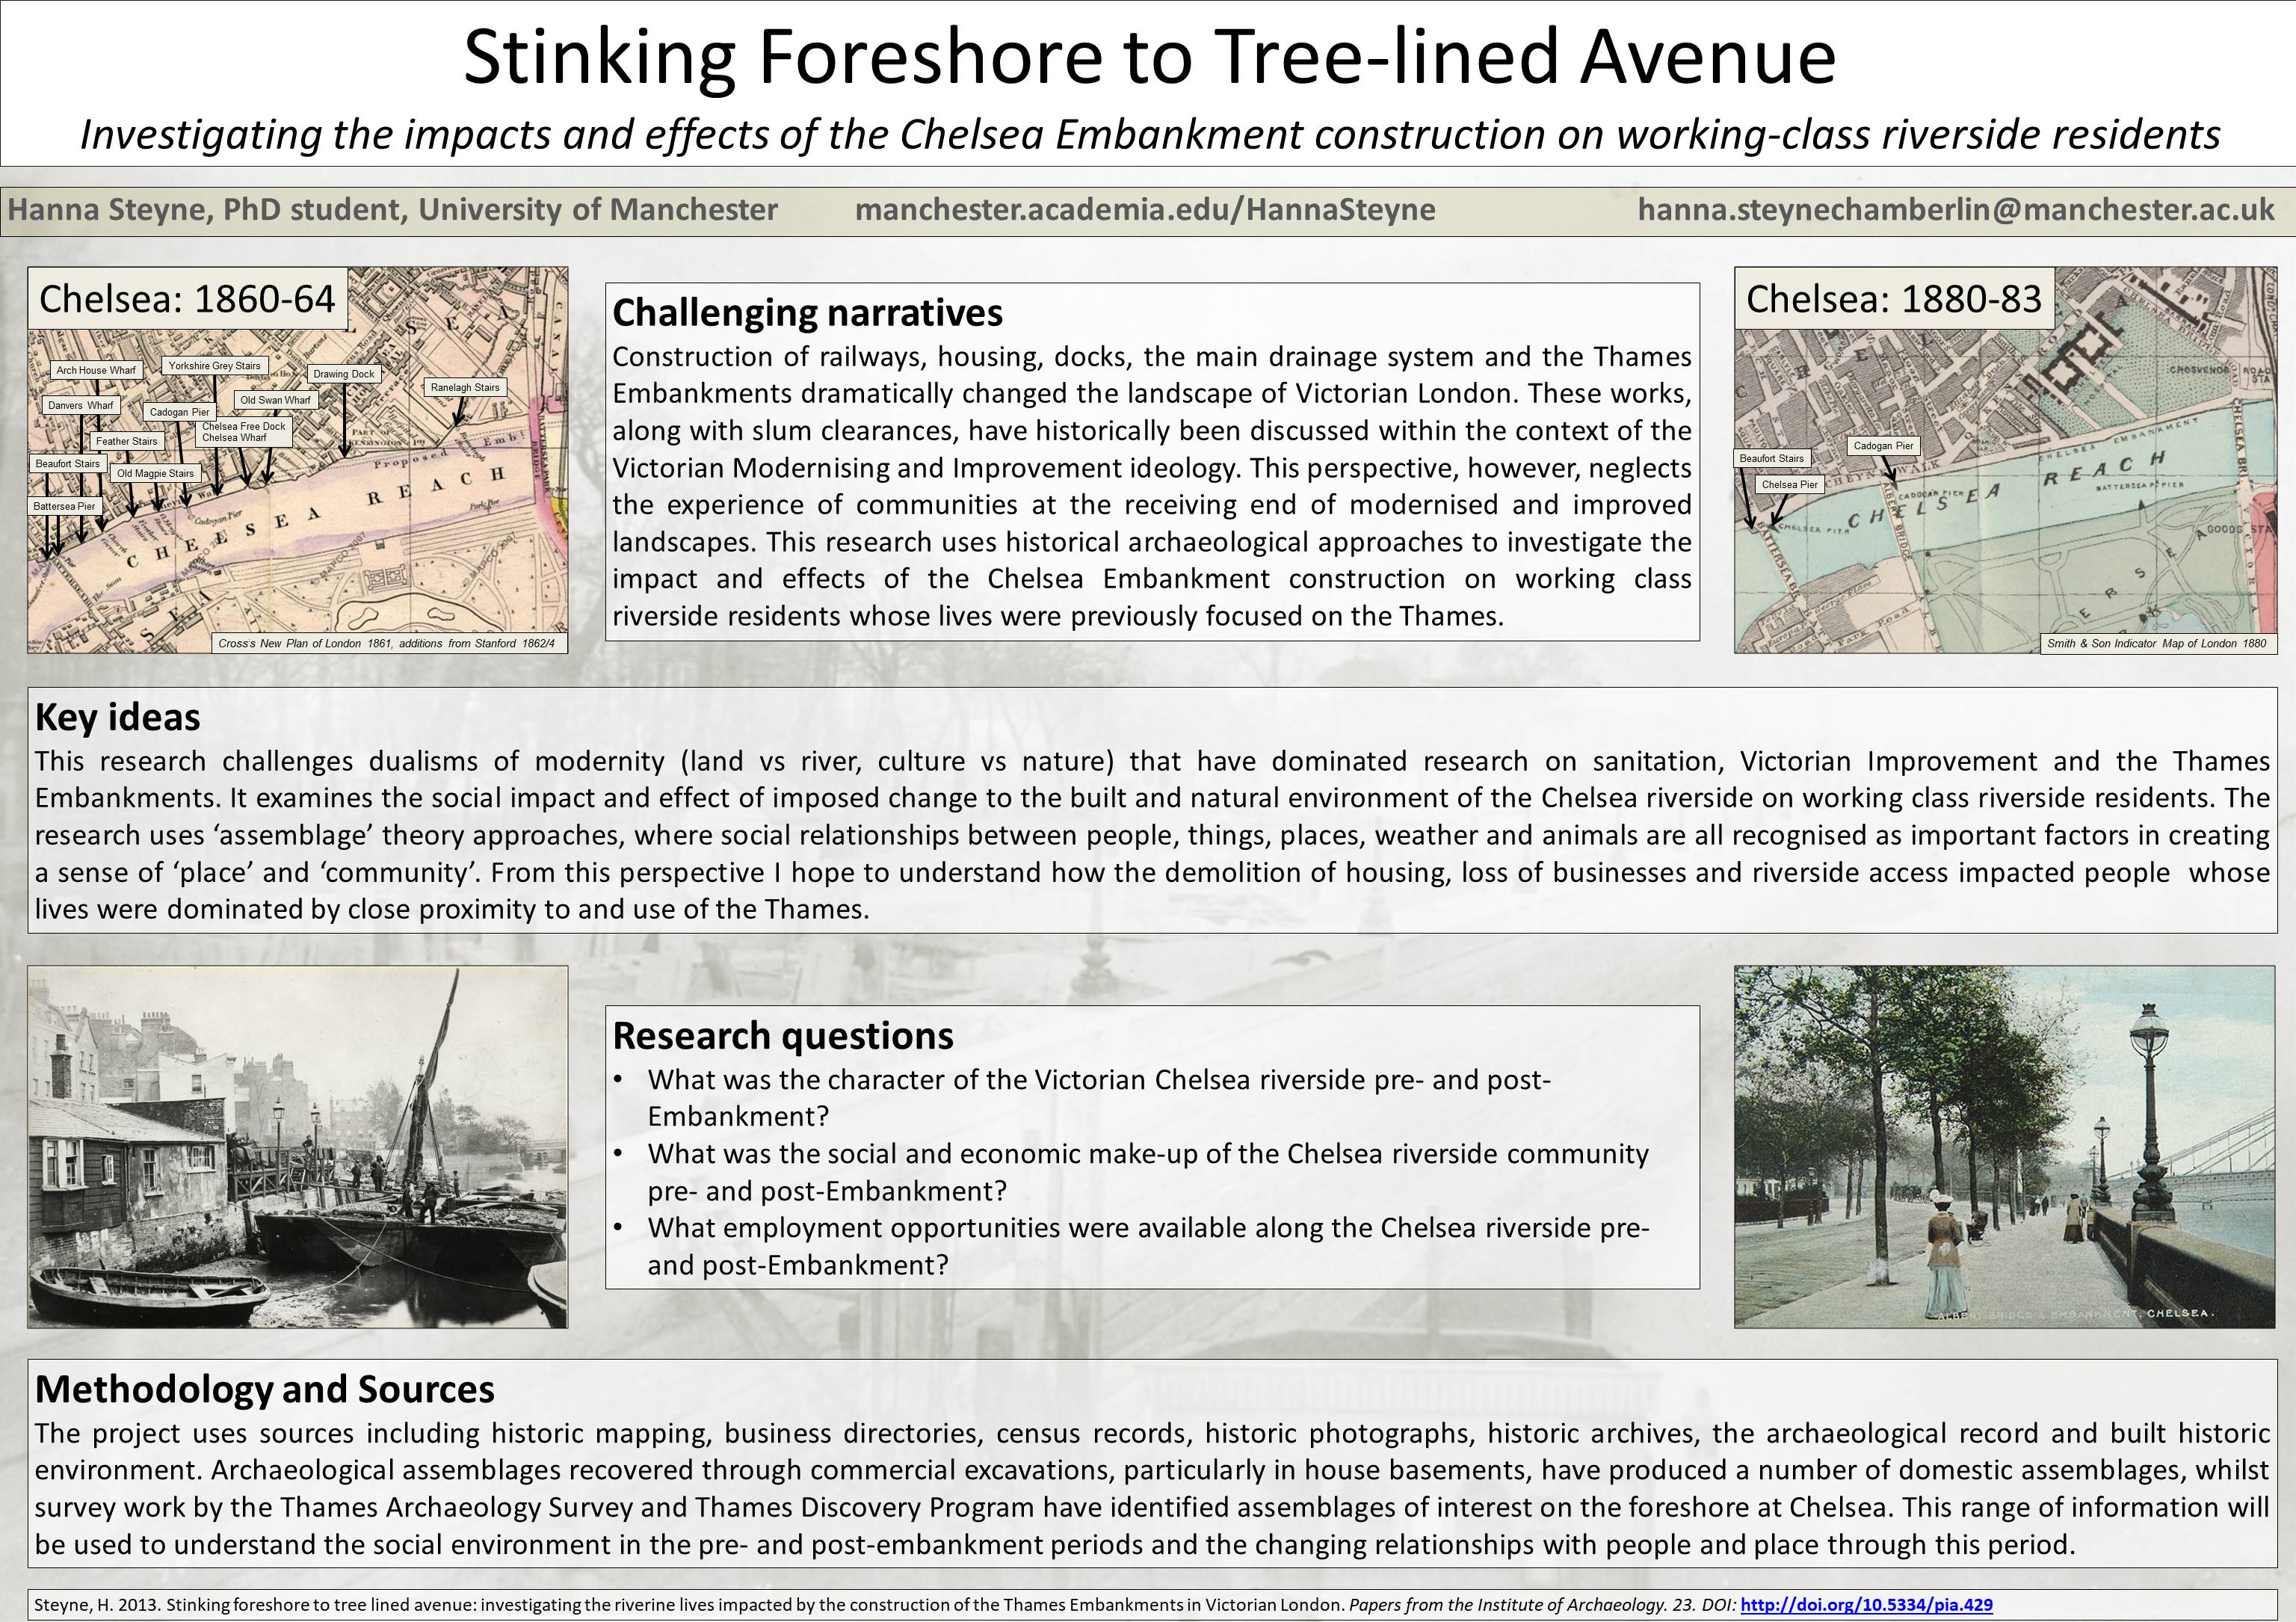
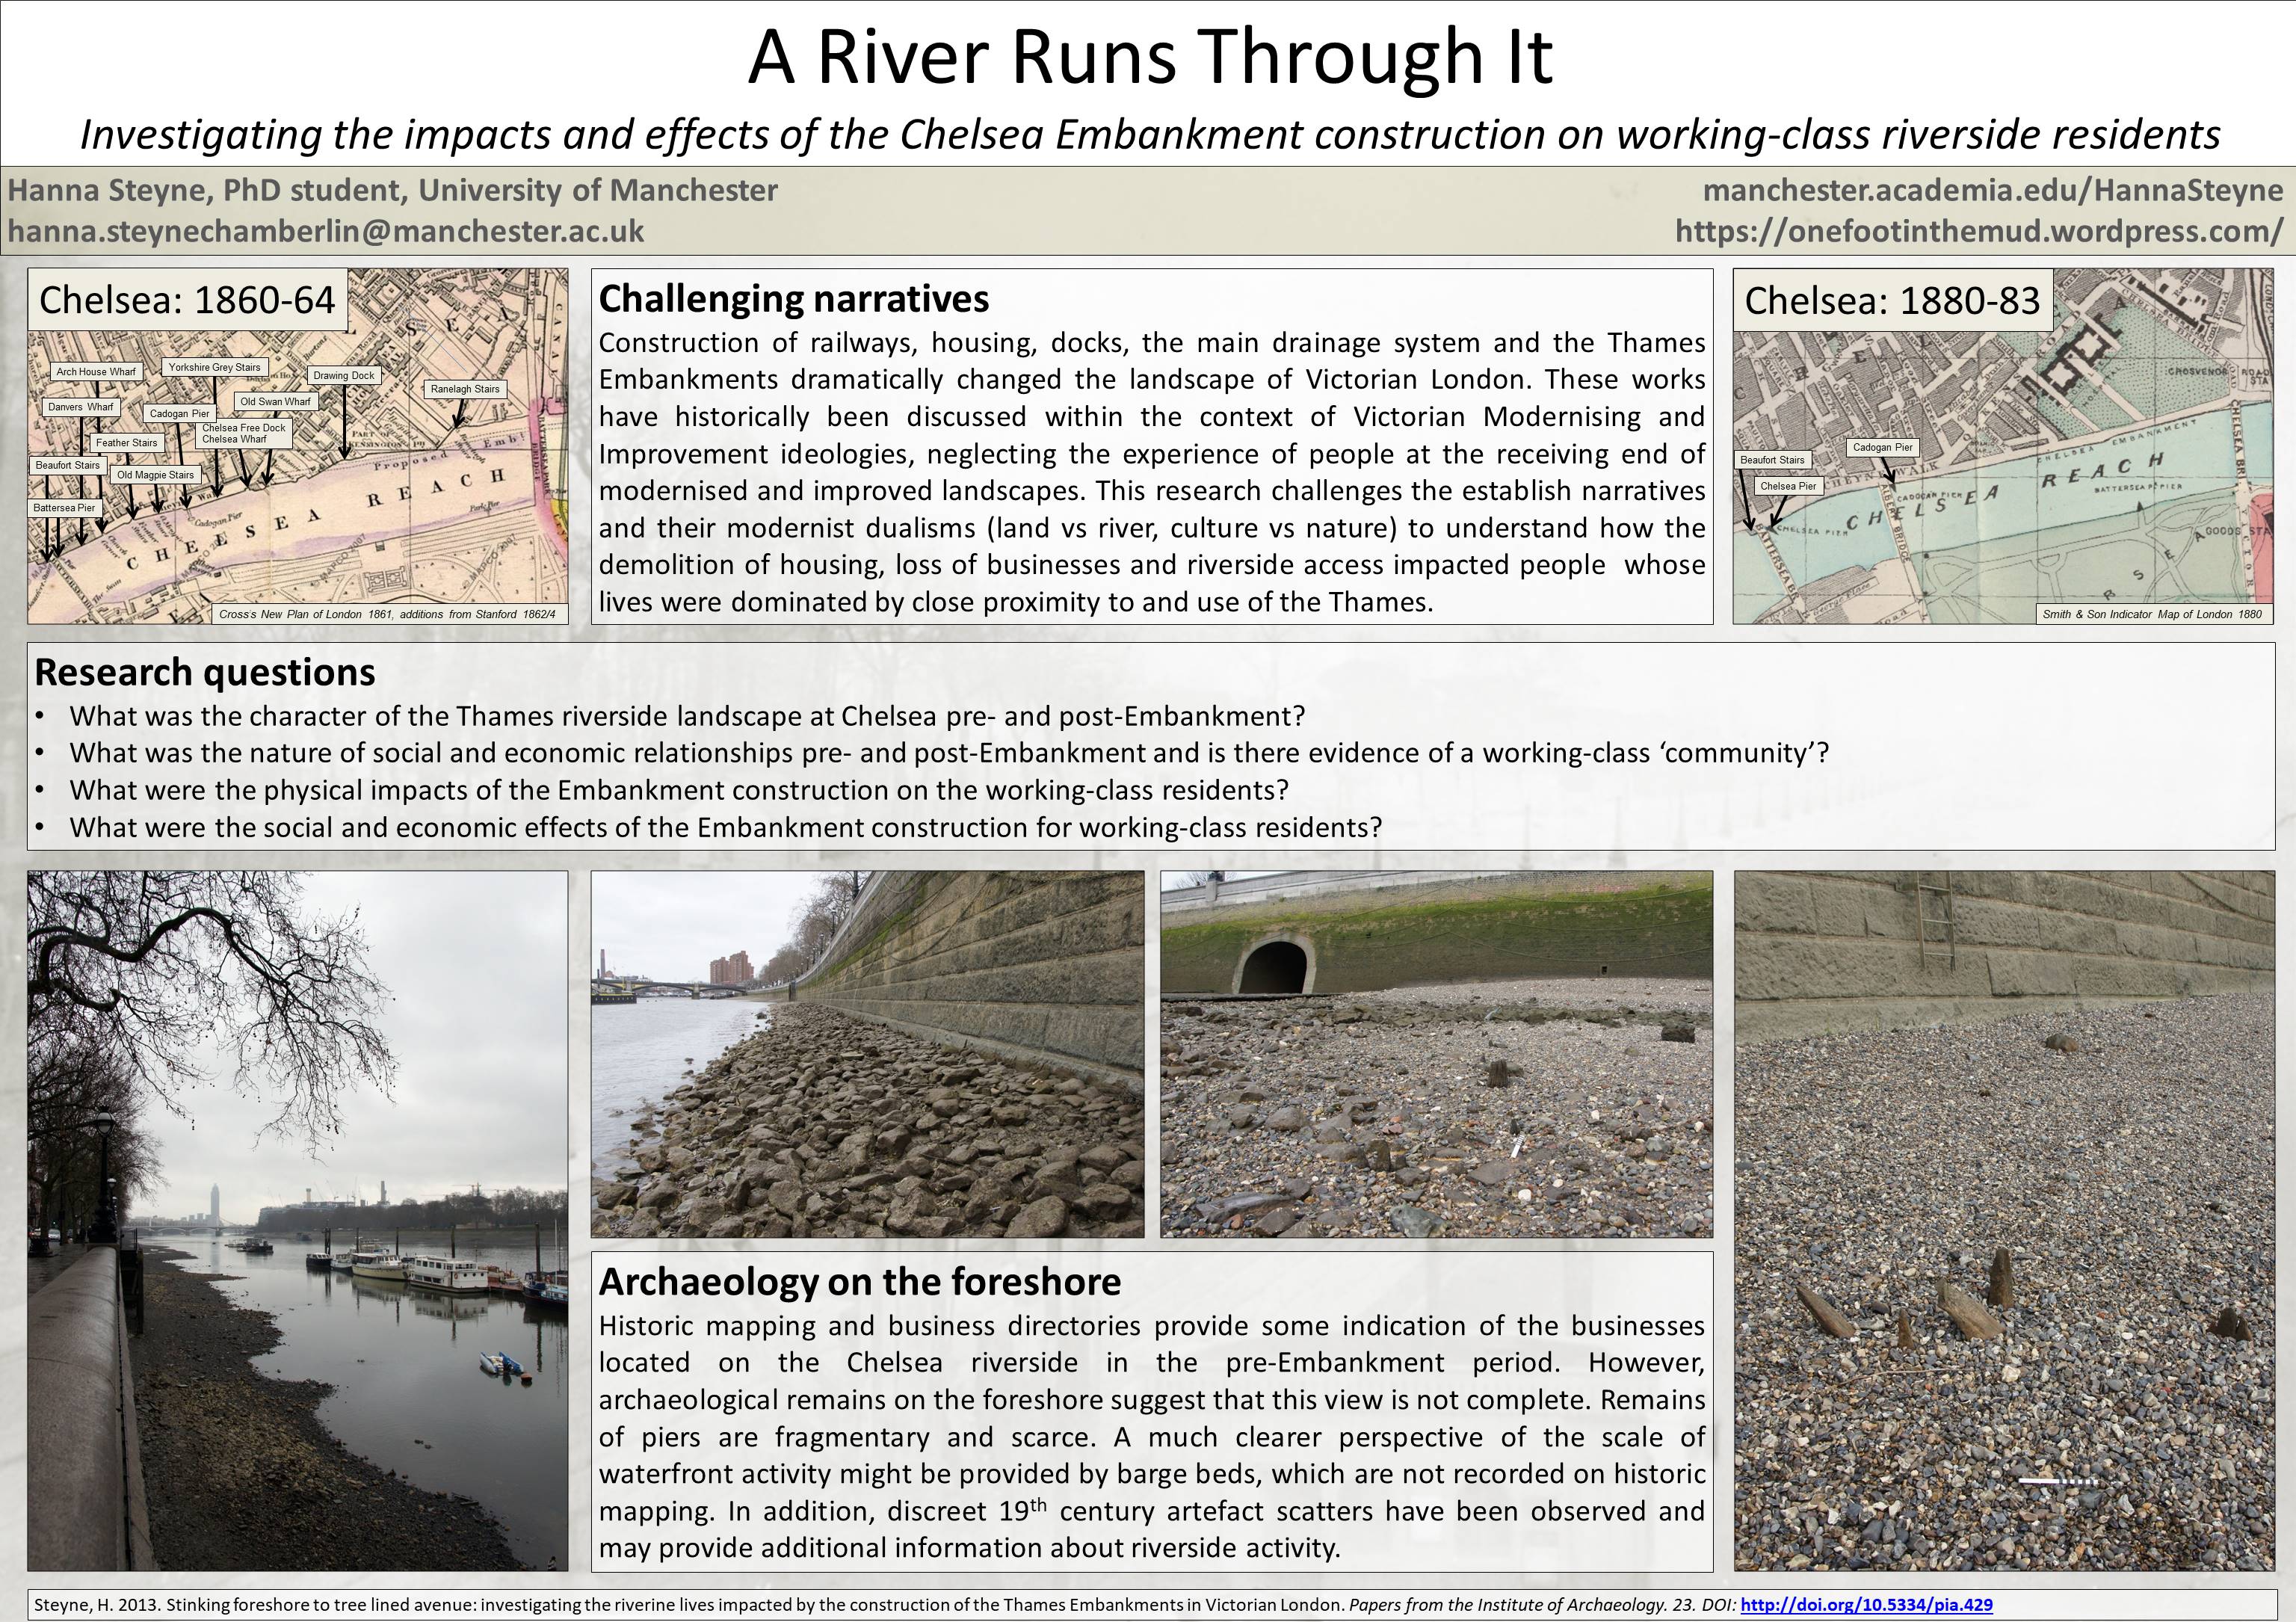
This paper presents a variety of approaches and source materials that I have used for my PhD research, and the different perspectives they have provided on the impacts and effects of the construction of the Chelsea Embankment. My research may not be classed as traditional industrial archaeology, however the construction of the Thames Embankments, the associated Main Drainage System and associated pumping stations were undoubtedly one of the major pieces of industrial water management of the 19th century. I, and many others, have suggested previously that the wider social and economic impacts of such industrial projects, should be considered more often within the context of industrial archaeological research, and this talk demonstrates that such research provides very different narratives of the process of industrialisation.
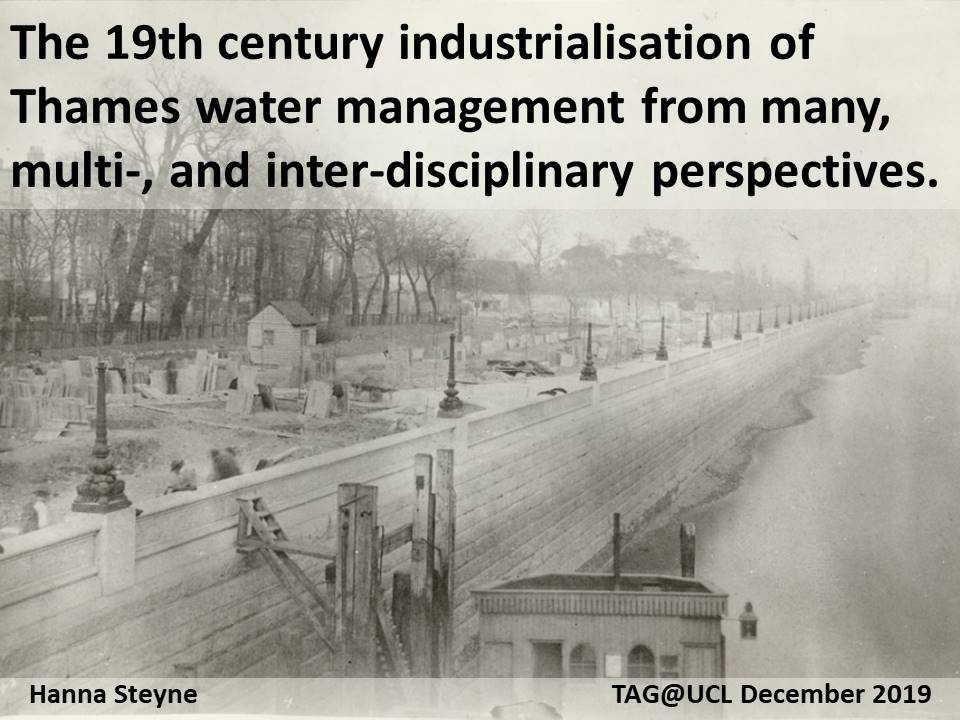
Slide 1: Background photograph of the Chelsea Embankment under construction by James Hedderly c.1870 (Royal Borough of Kensington & Chelsea Archives)
Whilst I am confident that none of these sources or approaches will be new to you in themselves, what I hope to demonstrate is that the combined value provides a unique perspective beyond traditional archaeological, historical or industrial archaeological approaches.
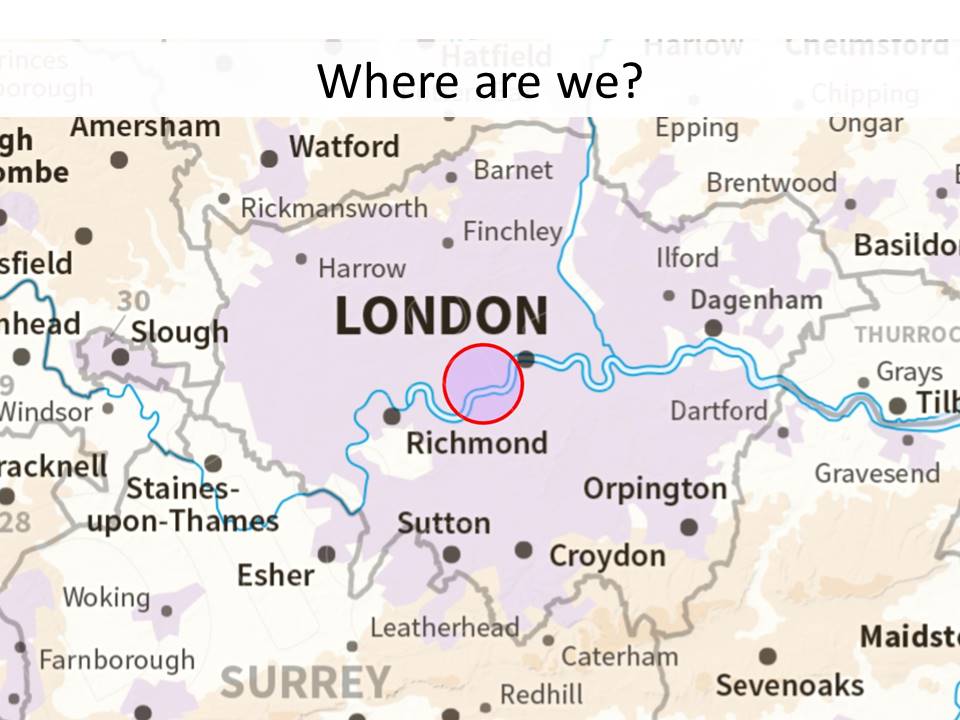
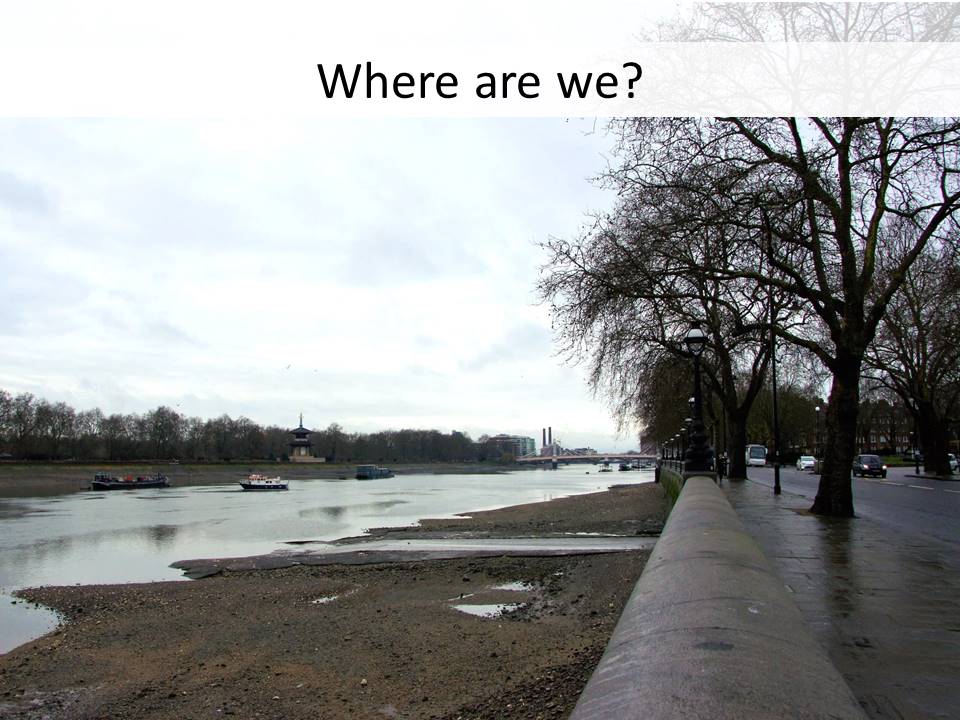
The Thames Embankments of central London, known as the Victoria (shown in Slide 2), Albert and Chelsea Embankments, are both iconic landmarks and yet relatively unobserved and uncelebrated functional pieces of 19th century industrial water management. The embankment of the river Thames in central London was carried out between 1865 and 1900 as part of a city wide scheme to improve sanitation through sewage removal, drainage, clean water provision and improvements to Thames water quality. The Embankment construction took place against a backdrop of industrialisation of the waterfront, including the establishment and expansion of factories, ship building, and dock facilities.
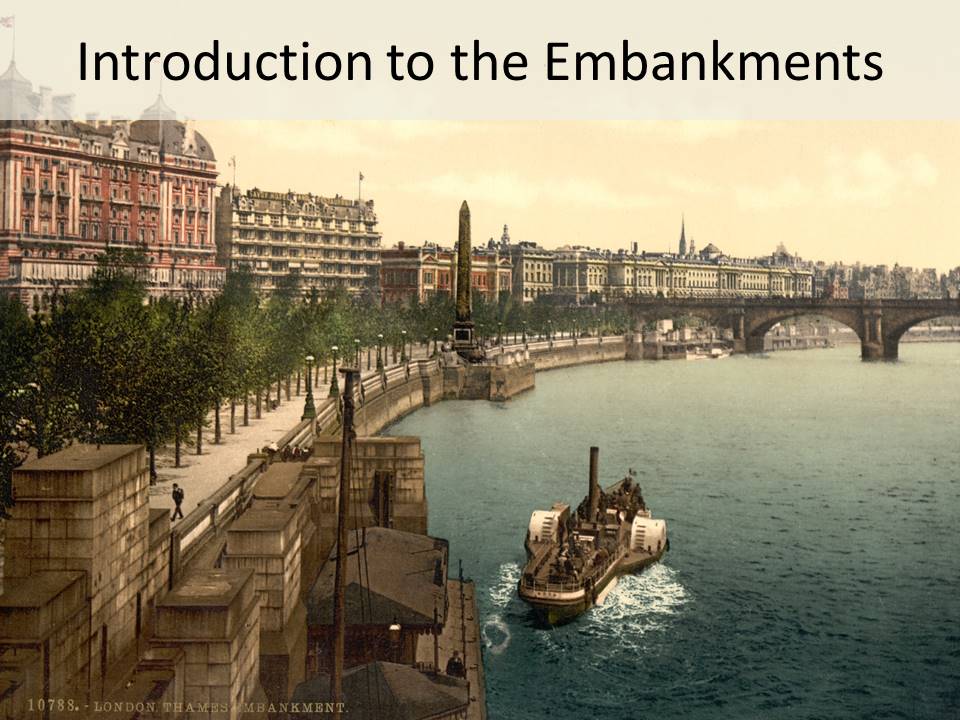
Slide 2: Background image is a postcard of the Victoria Embankment c1890-1900 (Library of Congress)
Strangely, there has been very little research on the Victorian Embankments and whilst they are mentioned in a number of published histories of London (White 2008, Nead 2000, Werner & Williams 2011, Picard 2005, Owen 1982, Porter 1994), we find the same series of facts about them repeated with very little critique or discussion. Largely information focuses on the designer, Bazalgette, and includes the dates of construction and the fact it contains the sewer and railway, often with the image shown in Slide 3.
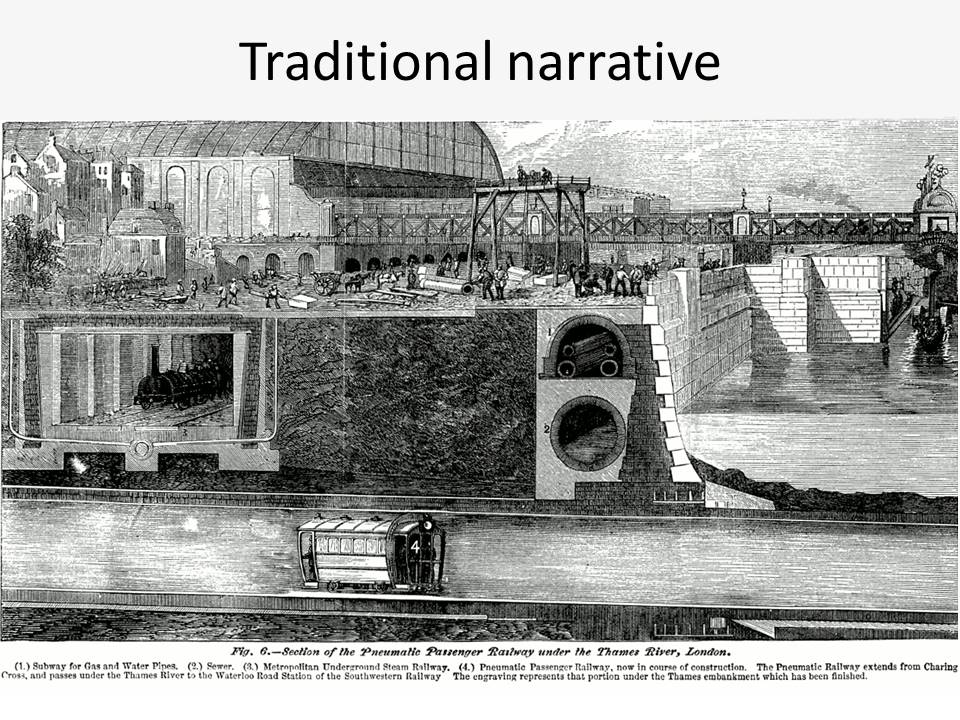
Slide 3: Background image is an engraving published in the ‘Illustrated London News’ dated June, 1867.
The Wikipaedia entry provides an example of this, although I might eventually find some time to both correct and expand some of the entry, which currently reads:
Started in 1862, the present embankment on the northern side of the river was primarily designed by Sir Joseph Bazalgette. It incorporates the main low level interceptor sewer from west London, and an underground railway over which a wide road and riverside walkway were also constructed, as well as a retaining wall along the north side of the River Thames. In total, Bazalgette’s scheme reclaimed 22 acres (89,000 m2) of land from the river. It prevented flooding; but it cut many waterfront houses and buildings off from boat access via their watergates. Here the entry refers to houses of the very wealthy, whose large gardens backed onto the river via watergates and jetties, not those of the poor working class, whose houses abutted and overhung the waterfront.
It continues:
Much of the granite used in the projects was brought from Lamorna Cove in Cornwall. The quarried stone was shaped into blocks on site before being loaded on to barges and transported up the English Channel into the Thames.
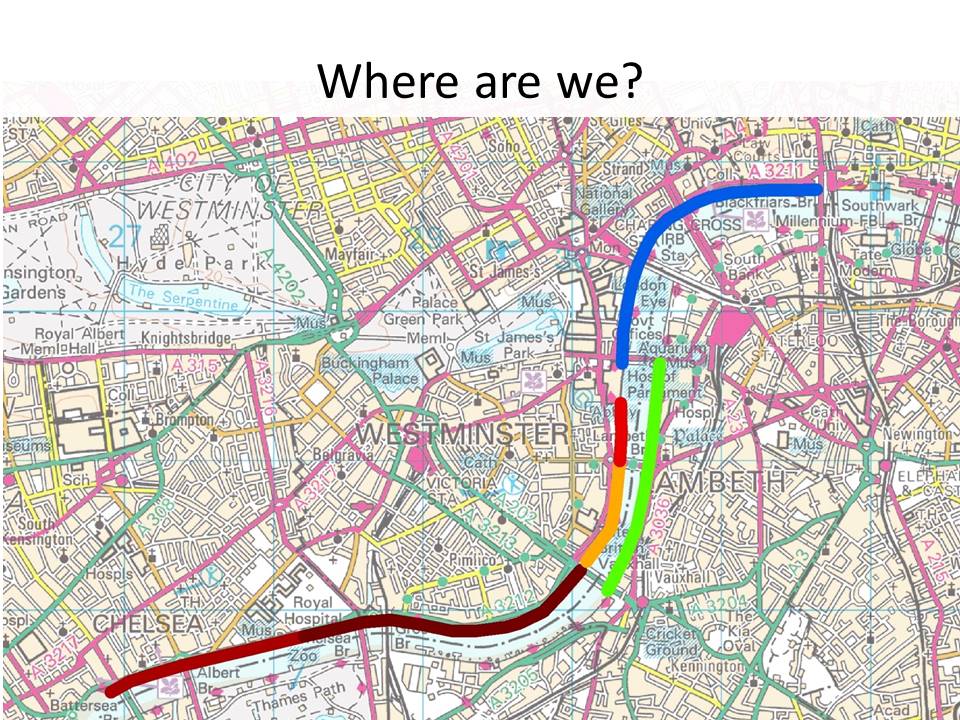
From Battersea Bridge in the west, the Thames Embankment includes sections of Cheyne Walk, Chelsea Embankment, Grosvenor Road, Millbank and Victoria Tower Gardens. Beyond the Houses of Parliament, it is named Victoria Embankment as it stretches to Blackfriars Bridge; this stretch also incorporates a section of the London Underground network used by the District and Circle Lines, and also passes Shell Mex House and the Savoy Hotel. The embankment also incorporates several stretches of gardens and open space, collectively known as the Embankment Gardens.
The much smaller Albert Embankment is on the south side of the river, opposite the Millbank section of the Thames Embankment. It was created by Bazalgette for the Metropolitan Board of Works and built by William Webster between July 1866 and November 1869.
Whilst this information is true, it is only one small part of the story. What I will present here demonstrates the variety of sources and approaches that I have used in my PhD research, and the way in which they can be integrated to tell alternative stories about the past.
Local history studies are hugely varied, but in Chelsea two major pieces of work have been of particular use to me (Deny 1996 and Richardson 2003). Like most local history studies, these two publications are focused on the ‘important’ people – artists and aristocrats, and the houses in which they lived. In addition to the houses of the rich and famous, civic buildings and public spaces are well documented and researched, including the churches, schools, hospitals, and some pubs, coffee shops and tea houses.
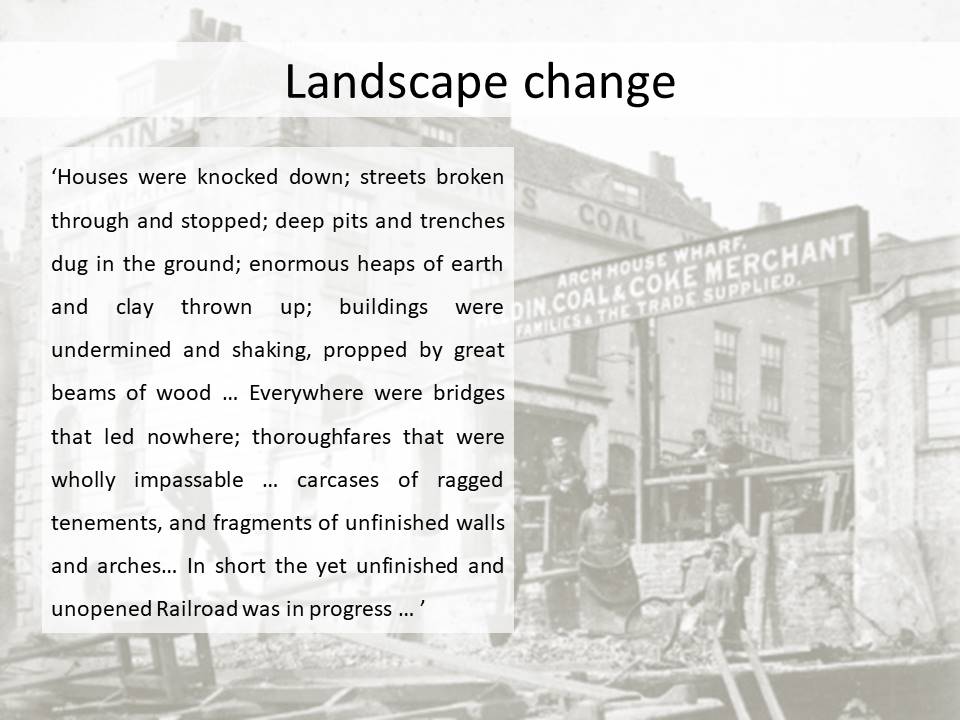
One mundane building that has attracted interest within local history studies is Arch House wharf – seen in Slide 4 with the green sign next to the Church. The form of the building, with an archway linking Danvers St and Cheyne Walk, is often mentioned, however there seems to be little detail on the history of the building. It was clearly a local landmark, however, as it appears on numerous paintings, but despite this, it was demolished as part of the Chelsea Embankment works.
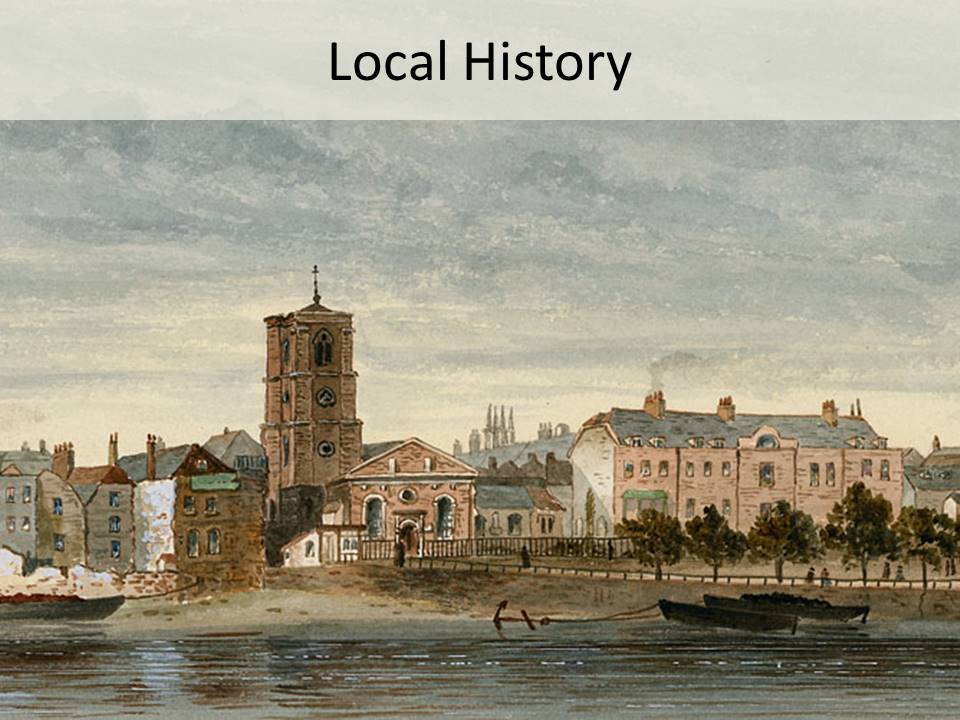
Slide 4: Painting by unknown artist prior to the Embankment construction (Look and Learn / Peter Jackson Collection)
What has been particularly useful in my research, has been the focus within local history studies on landmark buildings, particularly pubs, which has enabled me to more accurately georeference the historic mapping and, importantly, to orientate the house numbering on streets in the Census records. This was important as, whilst I suspected that the street numbering was sequential up and down streets, rather than the more usual evens on one side and odds on the other, I had no proof of this, and any mapping of residents would therefore be entirely made up, within individual street.
Using the local history research, I was able identify and geolocate pubs, link these with ‘victuallers’ (or pub landlords) within the Census records, and in historic paintings and photographs, where no pub name was recorded in the Census, historic mapping or business directory. By identifying a number of these within a single main street – Paradise Row/ Queen’s Road West – I could then work out the rest of the house numbers for buildings that were demolished in 1906. The results of this are below.
So, whilst it might be easy to dismiss traditional local history as focused on the rich and famous, within the research lies information which has helped to map and understand the lives of those on the back streets in unremarkable houses.
There have been two major pieces of historical research on the Thames Embankment, both of which focused on the engineers, engineering and technology of the construction works (Porter 1998 and Halliday 2001). This research was celebratory in its approach, exploring the incredible engineering feats and technologies developed as part of the Embankment construction works.
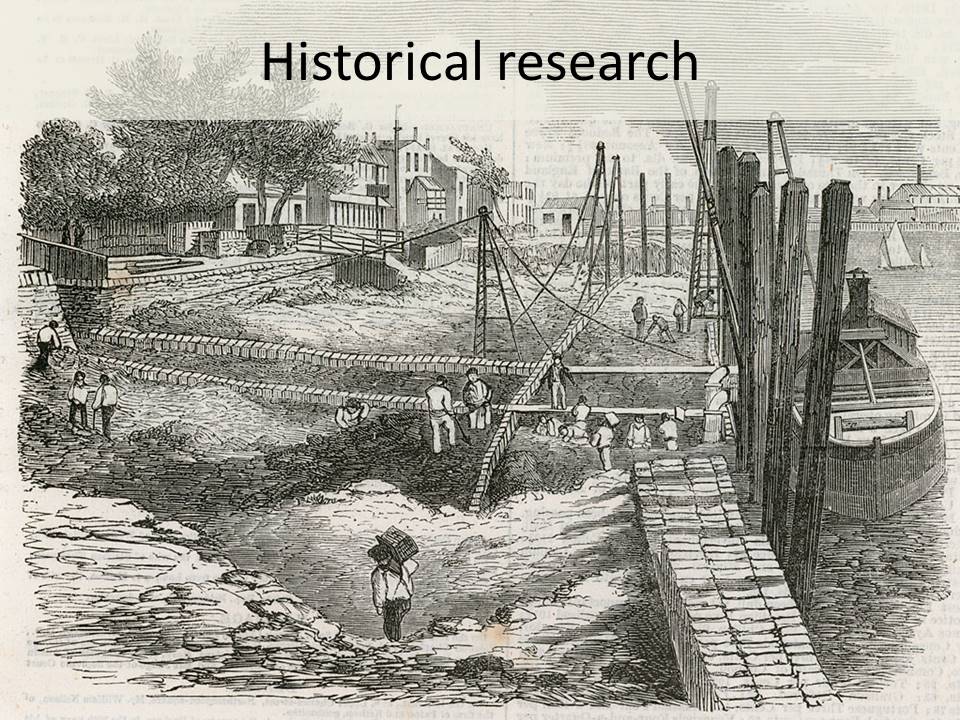
Slide 5: Background image of the Embankment under construction between Vauxhall Bridge and Chelsea waterworks, from an engraving in the Illustrated London News 1857.
The focus of historical research within my thesis has been on the people who were living and working in the areas in which the Embankment was built. So instead of using sources written by the engineers and various layers of government, I have been using the Census records and Trade Directories of 1851, 1871 and 1891 to research those who were directly impacted by the construction, through the loss of housing and employment. These sources provide an indication of the social and economic landscape of the area in the 20 years before and after the construction of the Embankment, and at the time of its construction in the 1870s.
Transcribing and digitising census records for around 4000 people has provided an incredible insight into the make up of the population. I have information about where people came from, the proportion of incomers vs Chelsea born people, the age and gender make up of the population, birth rates and family size, occupations and indications of family, colleague and friendship networks. For example we can see groups of young people coming to Chelsea from small towns across the country, including some siblings and presumably friends, working in the same trade, living together, often with a family member or older person from the same home town. There are many such stories within the data, or at least tantalising indications of interesting stories, a current favourite being a pair of children, from different families, both born in Australia at the height of the Gold Rush in 1860, whose families lived next door to each other in Chelsea in 1871.
Obviously, researching 19th century London opens up an enormous amount of historical data, but I’ve chosen to focus on Census data, which provides a fairly egalitarian view of who was living in Chelsea, certainly when compared to the local history research with its focus on the rich and famous.
The archaeological remains obviously play an important role in my research as well. Prior to my research, the only work done on this stretch of foreshore was by the Thames Discovery Programme (TDP). The Thames Tideway work at Chelsea took place after my fieldwork, and was limited to the foreshore in front of the Hospital (I should probably do something with the survey data on the possible 17th century jetty we found). The TDP surveys had recorded 24 features between Battersea and Chelsea Bridge, but I was able to increase this to 95 features, including timber posts and structures (Slide 6), barge beds (Slide 7) and artefact scatters.
The timber posts and structures tie in surprisingly well with the historically recorded commercial wharves, as do the barge beds and artefact scatters. What is of particular interest to me is the volume of activity that the archaeological material indicates was taking place on the foreshore, which is just not evident from any other source.
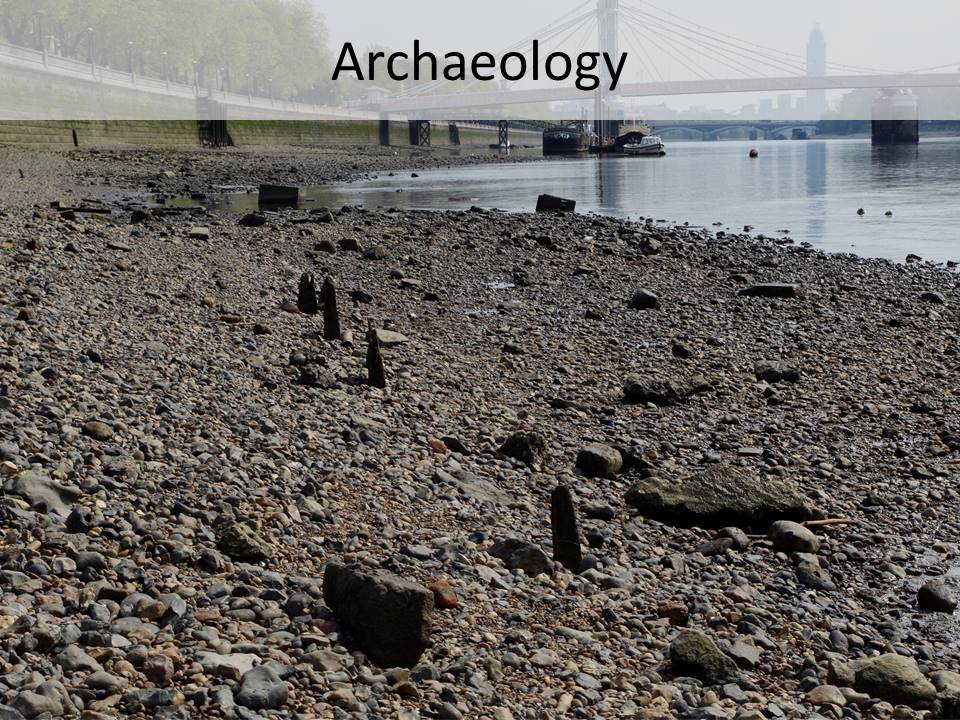
Slide 6: Timber post structure on the Thames foreshore at Chelsea (Photograph Hanna Steyne)
The barge beds are of particular interest as they are not a feature well recorded or researched (Slide 7). They can be seen here as a jumble of chalk blocks on the foreshore, but would have provided a soft, level surface for wooden hulled barges to rest on at low tide. The scale of them suggests that the number of vessels being beached at any one time was far greater than might be assumed from the historic mapping, or indeed from some of the paintings of the waterfront, which present a fairly quiet bucolic scene. But I’ll discuss paintings in a minute.
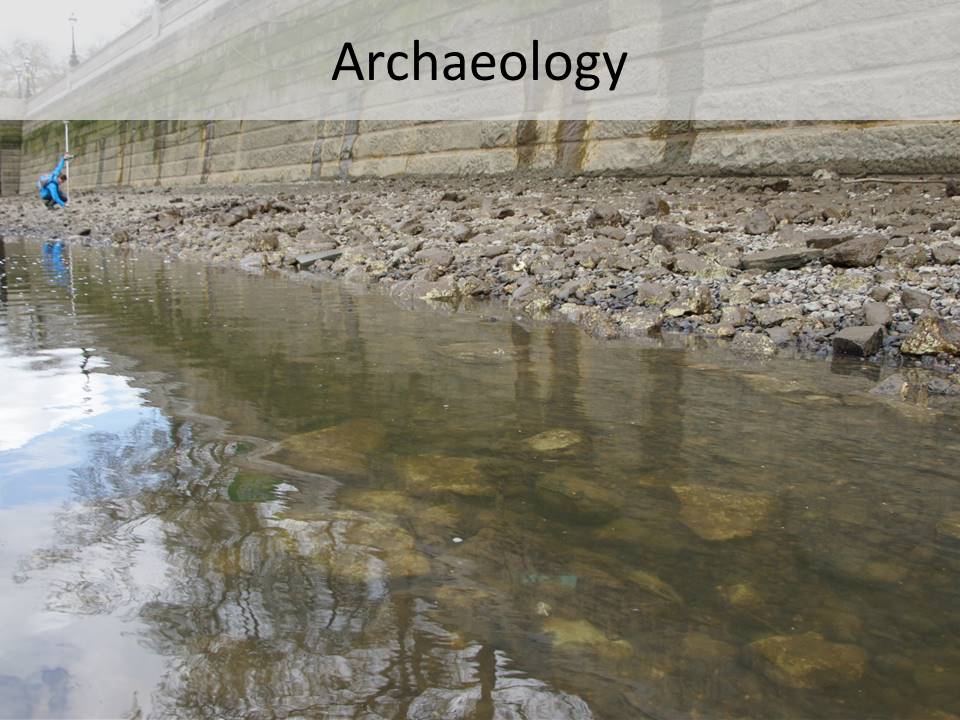
Slide 7: Chalk barge bed on the Thames foreshore at Chelsea (Photograph Hanna Steyne)
My first encounter with historical geography was when I first started out on my PhD and an archaeologist dismissed my research ideas as ‘just historical geography’. Since then I’ve been trying to work out what historical geography actually is, and whilst I’m still not entirely sure it has a ‘definition’ as such, it is clear that it includes a wide range of research on places and people in the past. One piece of historical geography by Stuart Oliver (2000) explored the creation of the Thames Embankments as cultural landscapes and an example of controlled nature in the urban space, and the embodiment of the Victorian narrative of Modernisation and nature.
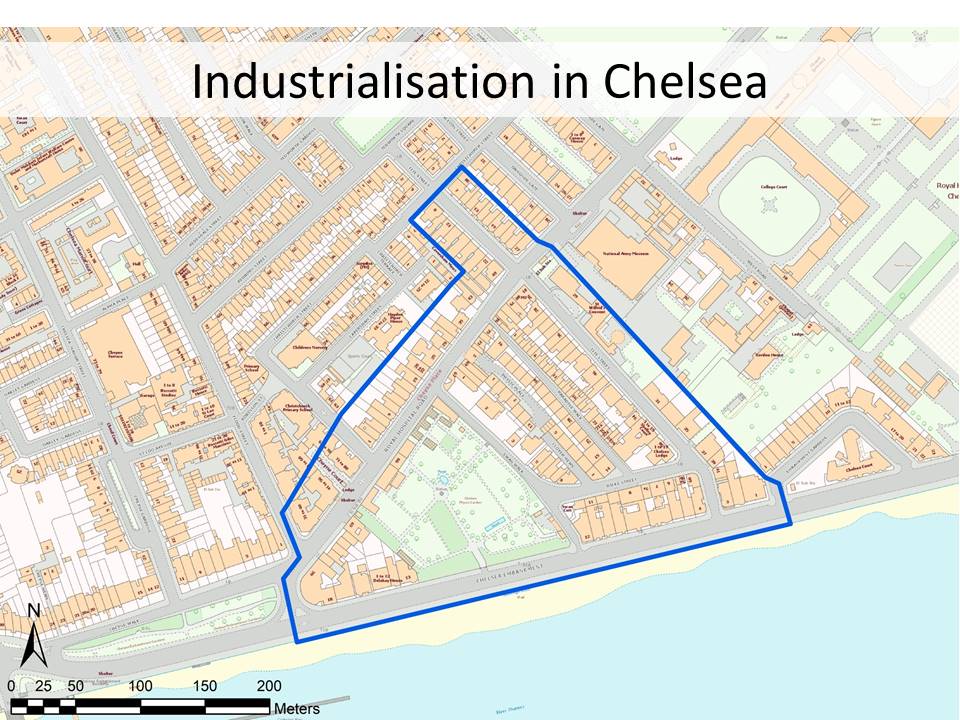
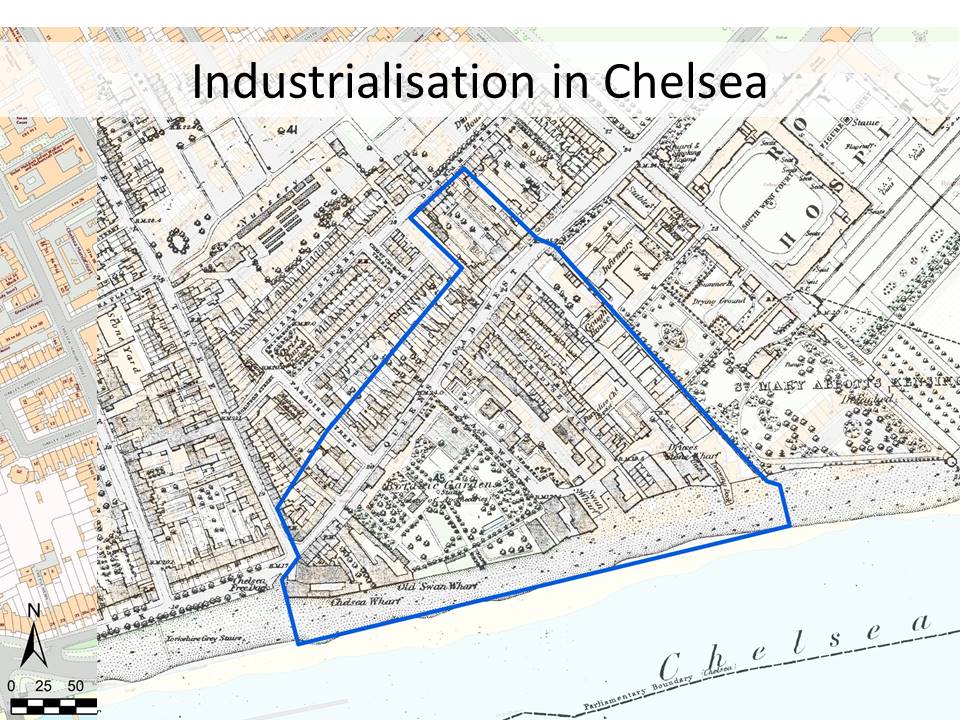
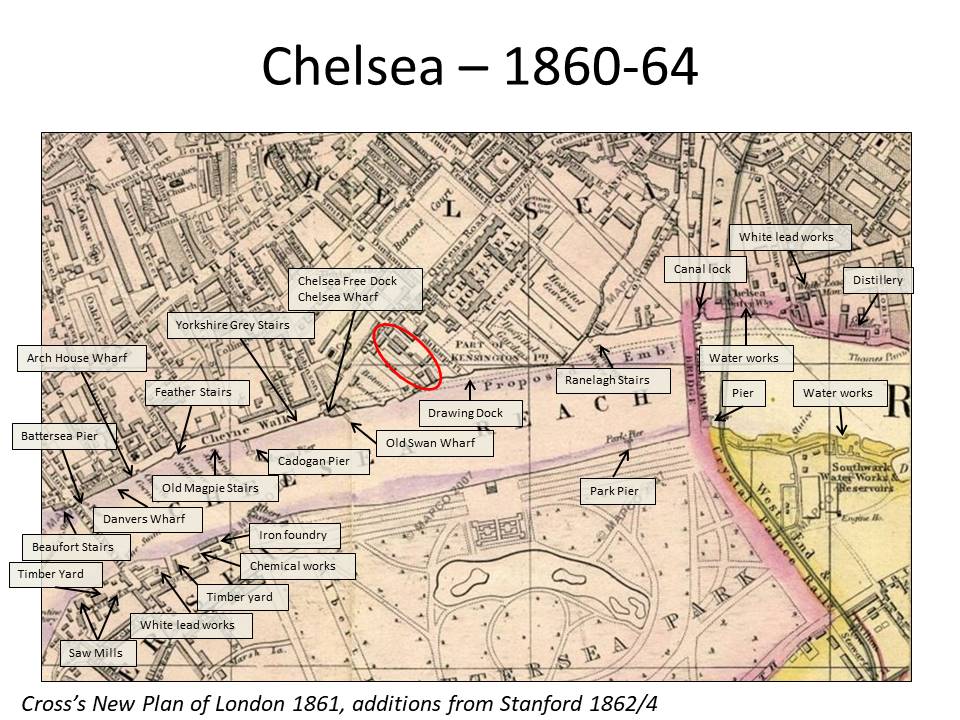
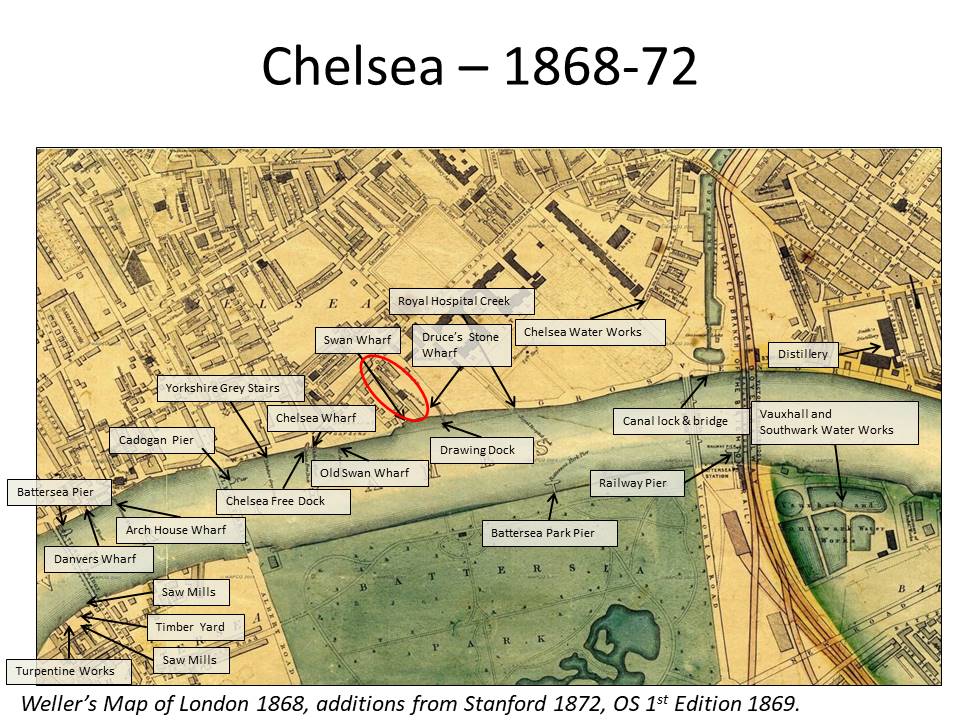
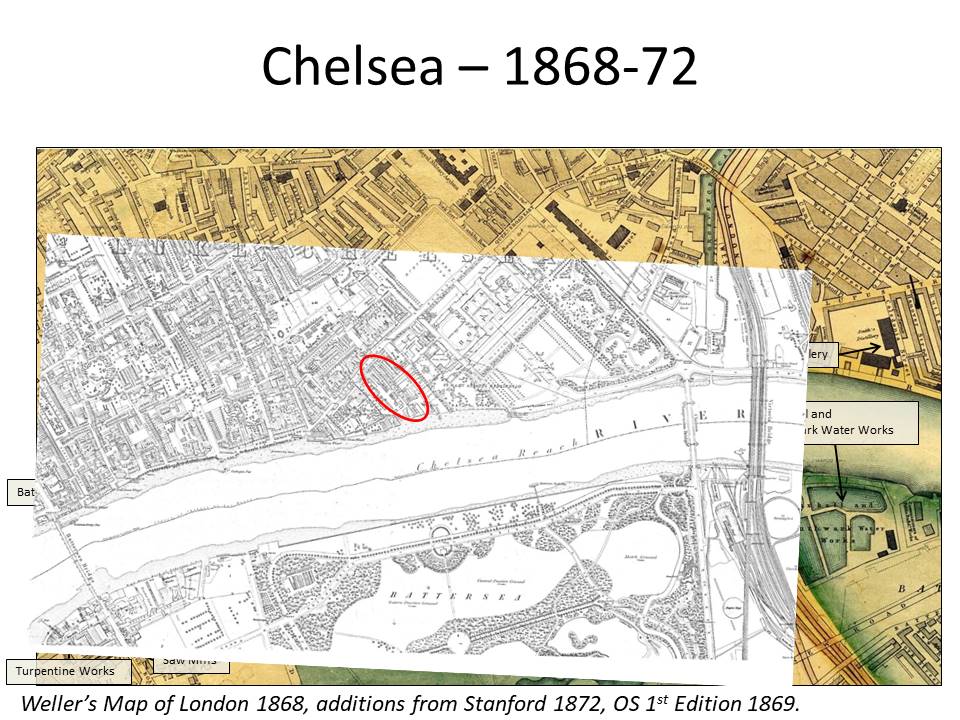
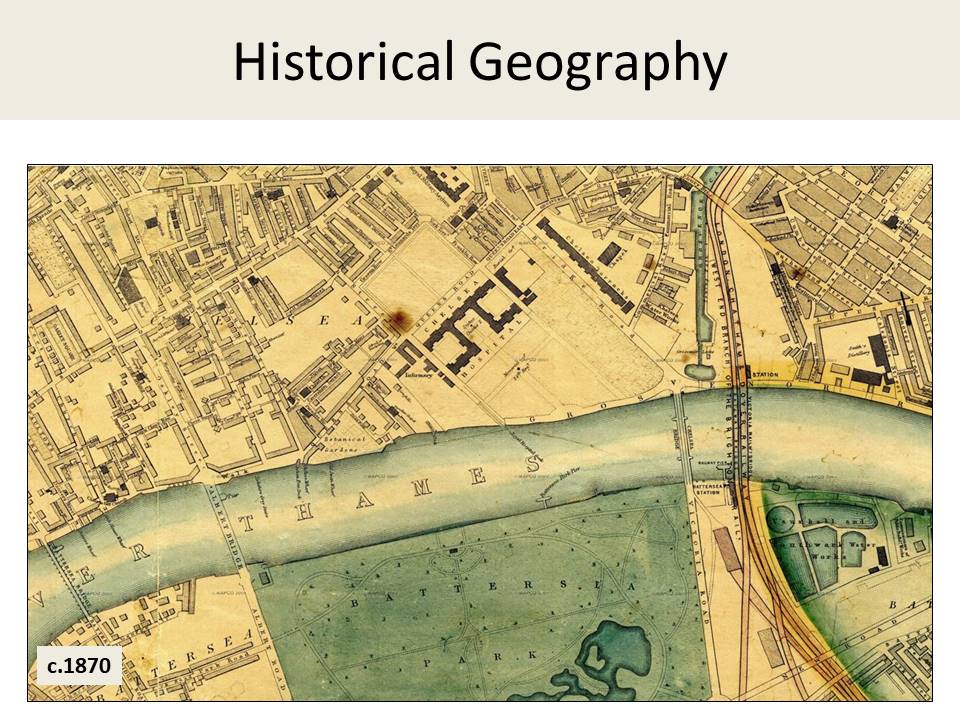
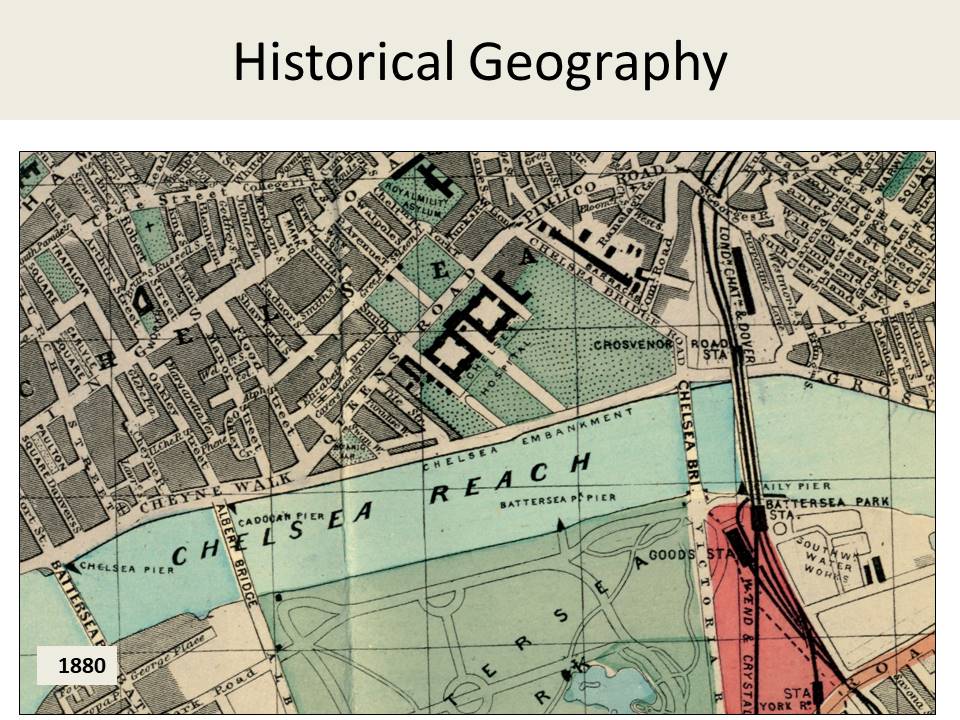
The part of my research which most easily illustrates the value of an historical geography approach is that most traditional of archaeological tools, the map regression (Slides 8-13). This approach helps identify changes in the built and natural landscape through time, and in my research plays a key role in identifying the physical impacts of the Embankment construction, particularly in terms of the residential and commercial premises that were demolished.
What has been particularly interesting has been the variation in what was surveyed and recorded on each map, reflecting the aims or purpose of each map. It is interesting to note that on many maps, little attention was paid to accurately recording the back streets or waterfront buildings.
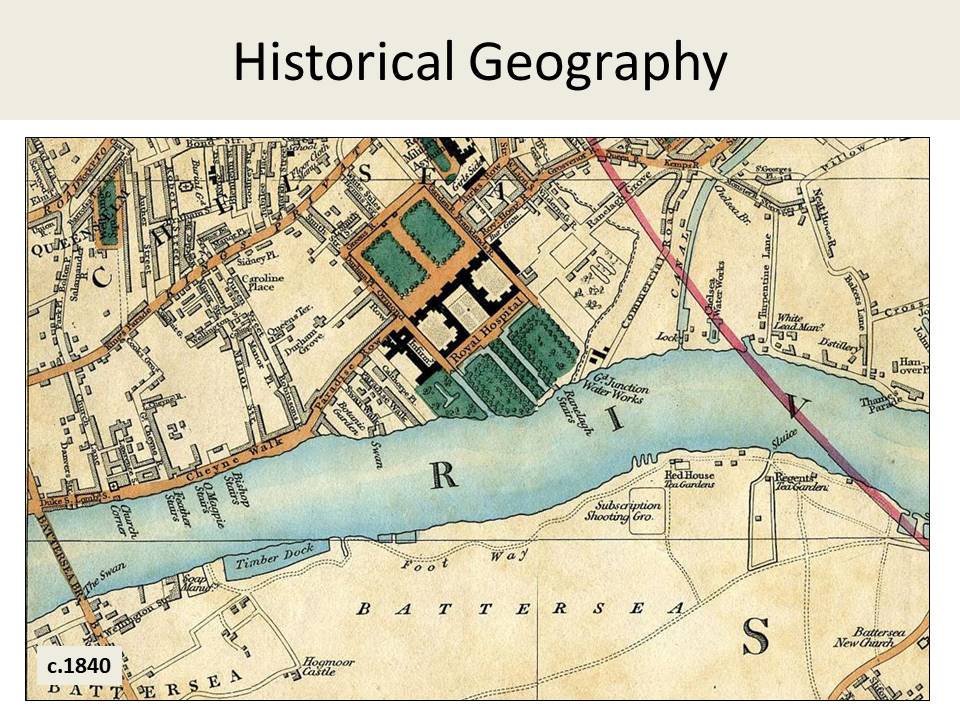
Slide 8: Cary’s New Plan of London and It’s Vicinity 1837 (Mapco.net)
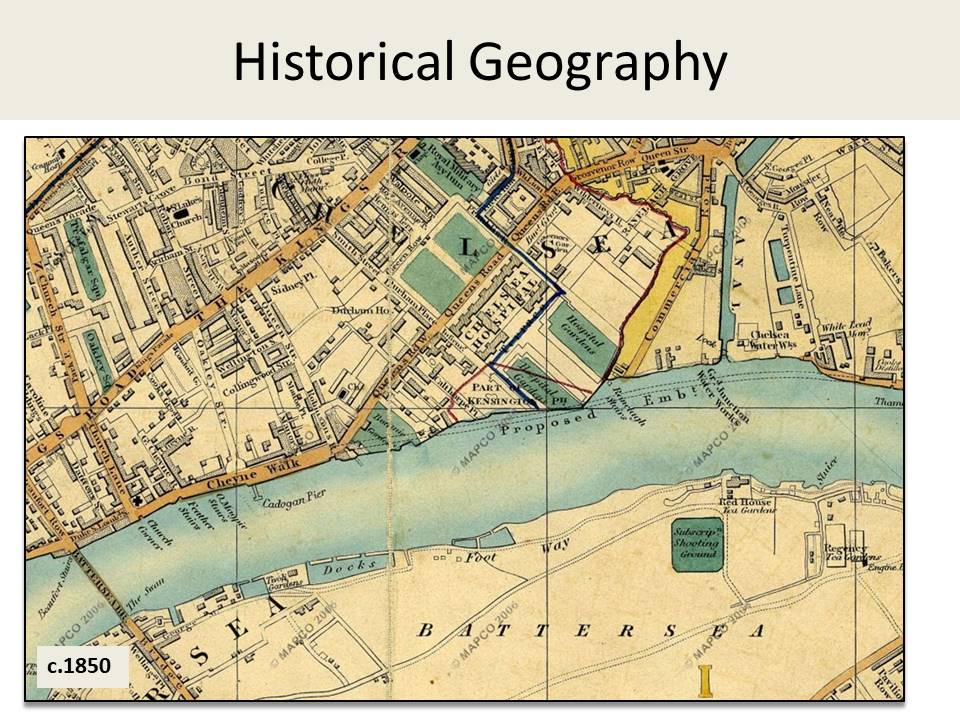
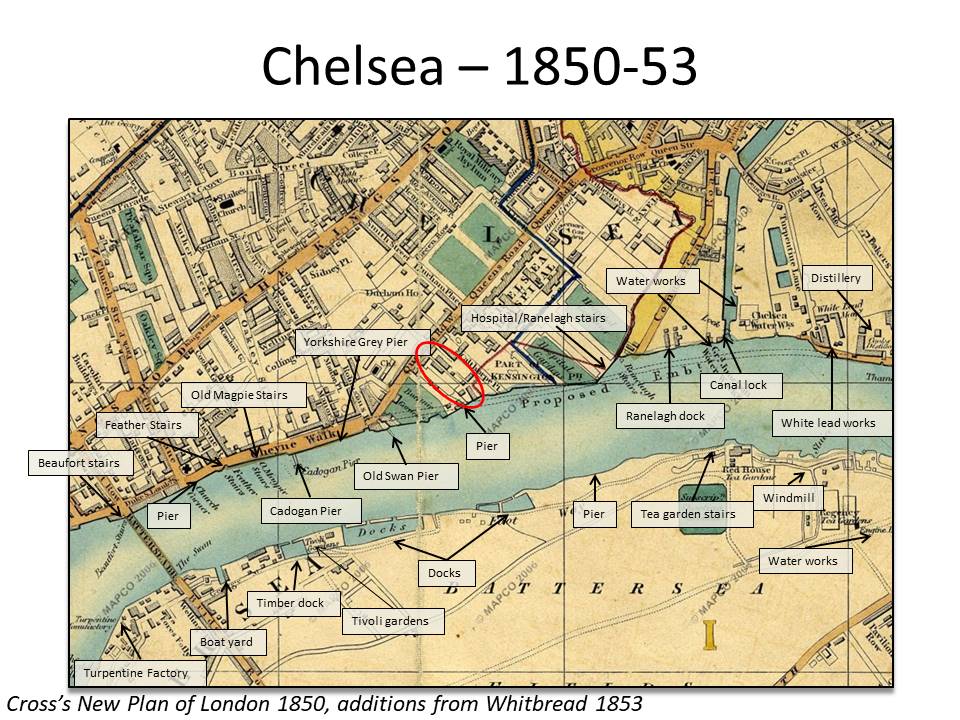
Slide 9: Cross’s New Plan of London 1850 (Mapco.net)
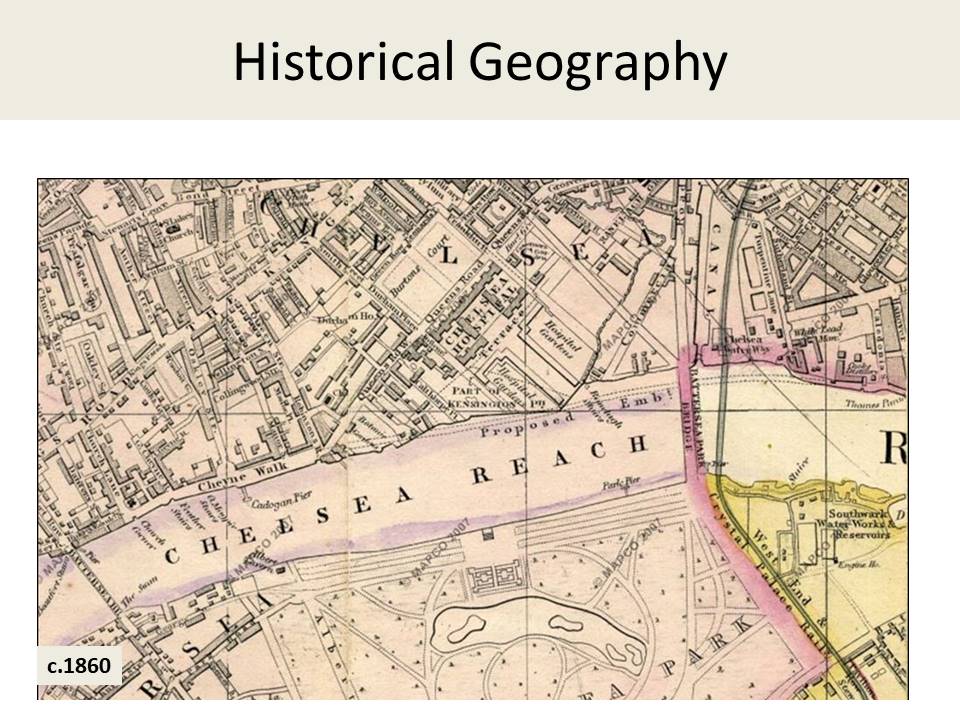
Slide 10: Cross’s New Plan of London 1861 (Mapco.net)
Slide 11: Weller Map of London 1868 (Mapco.net)
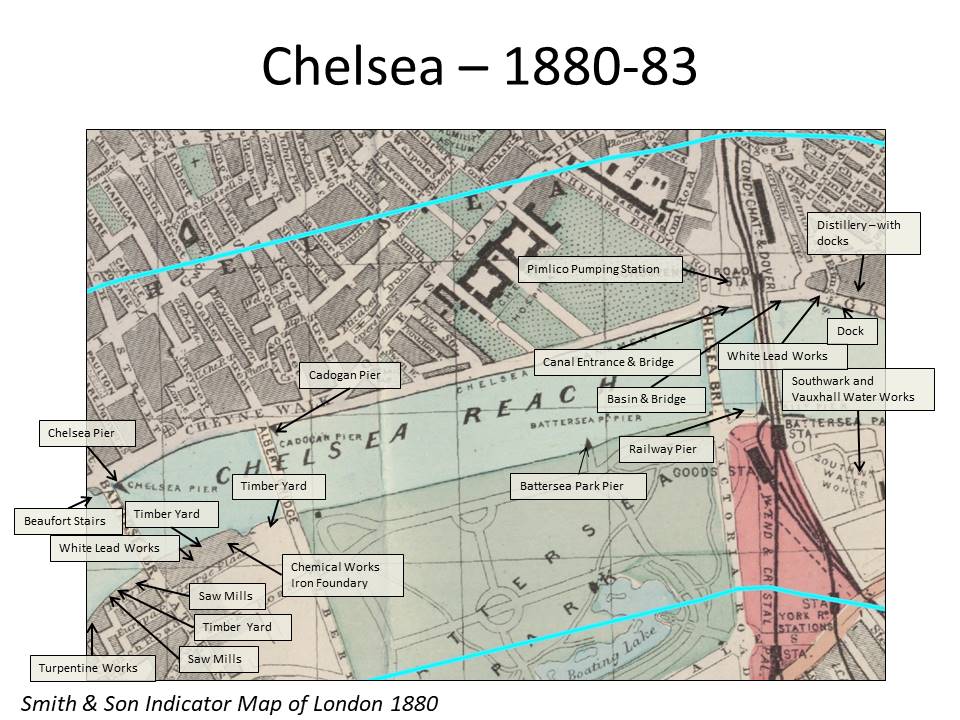
Slide 12: Smith’s indicator Map of London with the Recent Improvements 1880 (Harvard Geospatial Library)
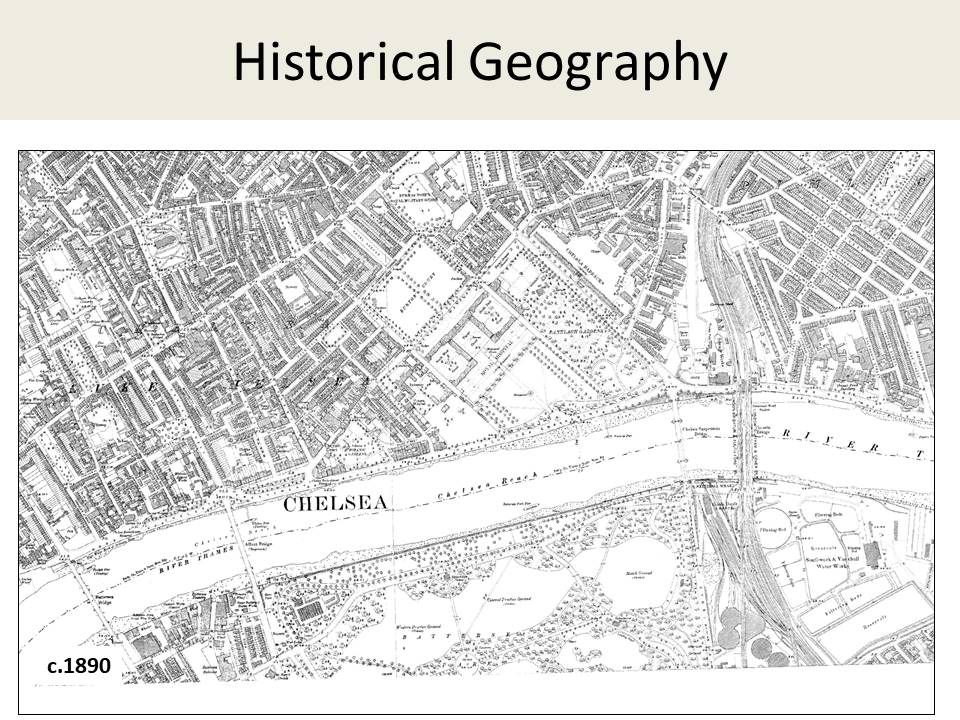
Slide 13: Ordnance Survey map 1894 (Edina Digimap)
Artistic representations of Chelsea in the 19th century are extremely numerous, partly I suspect because of the number of artists who were attracted to live in the area. The waterfront was known as being particularly picturesque with its wide roadway, old buildings, trees and a variety of boats on the river. These images, a selection of which are in Slide 14, are a valuable addition to research, above and beyond photographs, because they provide subjective depictions of the landscape, giving indications of personal perceptions of the waterfront, what features were considered important or picturesque, and interestingly who was considered appropriate to depict as being on the waterfront.
As mentioned earlier, these images were also really useful to locate commercial premises based on shop fronts and signage recorded in paintings. It was really interesting, and good fun, trying to locate accurately the view point of these paintings and the position of the scenes.
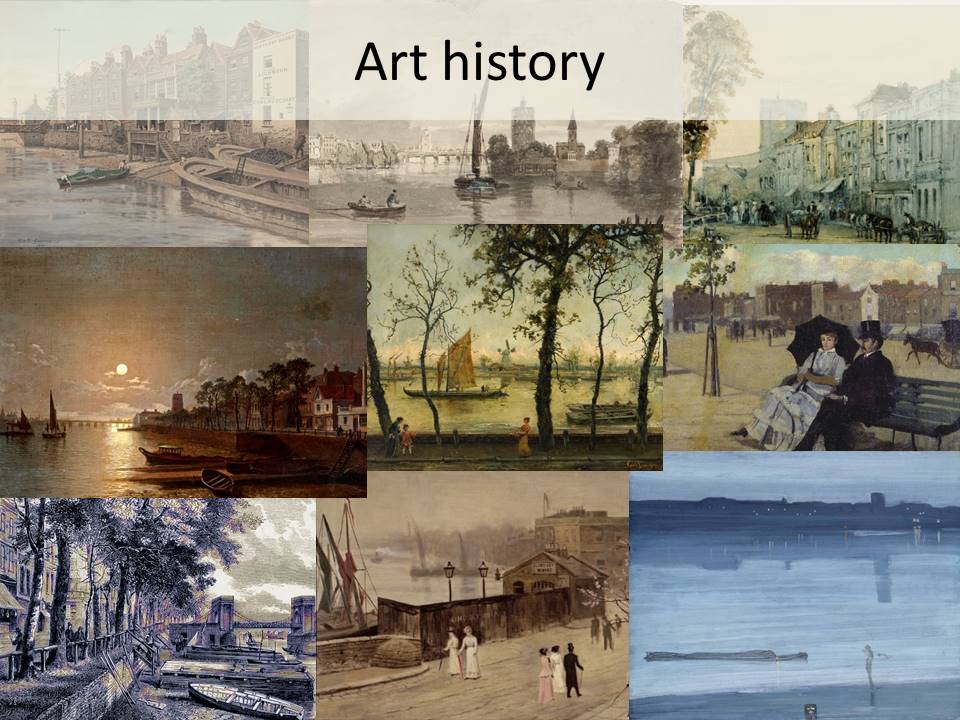
Slide 14: A selection of paintings of the Chelsea waterfront. From l-r, top row: Walter Greaves 1858, Joseph W Turner 1797, Unknown artist 1840; middle row Henry Pether 1850, Cecil G Lawson, Walter Greaves 1880-90, bottom row: Illustration from Old and New London by Edward Walford. artist & date unknown, Walter Greaves unkown date, James Whistler 1871.
The field of Digital Humanities is a relatively new and developing field, however the it is of particular interest for my research, and interdisciplinary approaches generally, because of the focus on the use of digital technology to mine, visualise and analyse data in order to draw out new patterns and stories about people in the past.
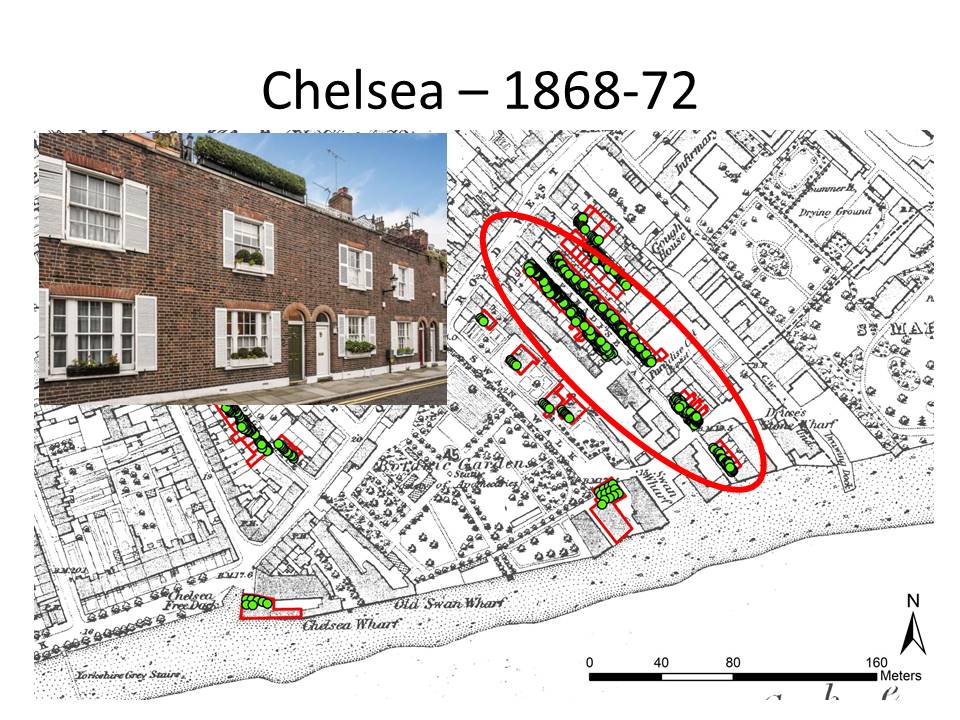
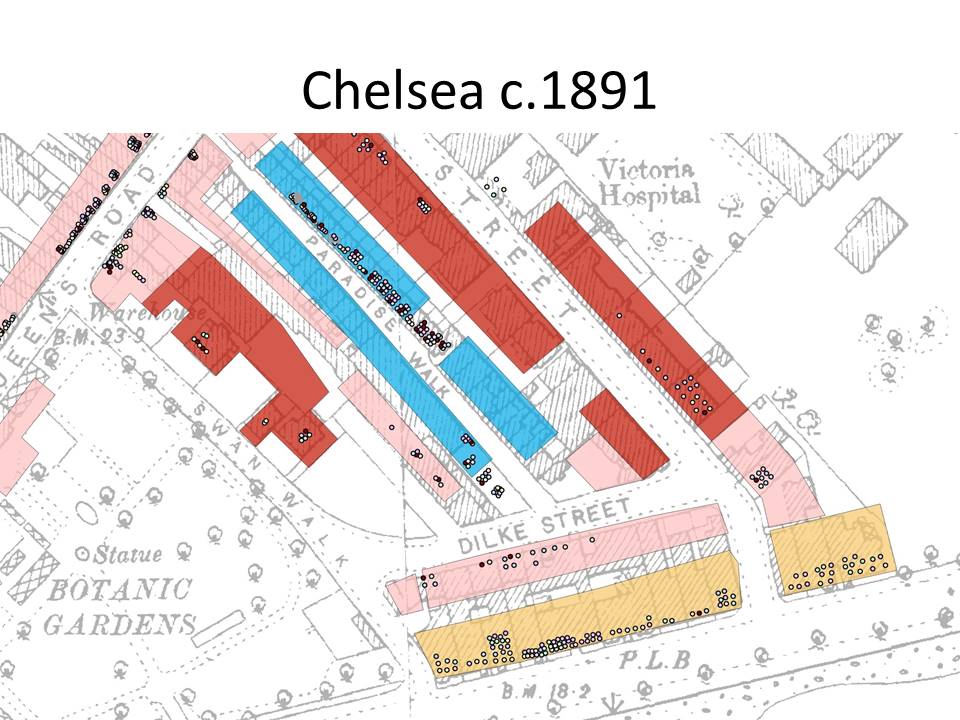
My research has digitised the Census Records from 1851, 71 and 91 to spatially visualise individuals listed within households and addresses in my study area. In Slide 15 each address is digitised (red lines) based on historic mapping, and each person entered as an individual point (green).
What this has allowed me to do in my analysis of the data, is see links between people that might not have been picked up in traditional readings of Census records. Slide 15 shows the 1600 ish entries for 1871, just before the Embankment was built, and I’ve done the same for 1891 and am in the process of putting 1851 dots on maps.
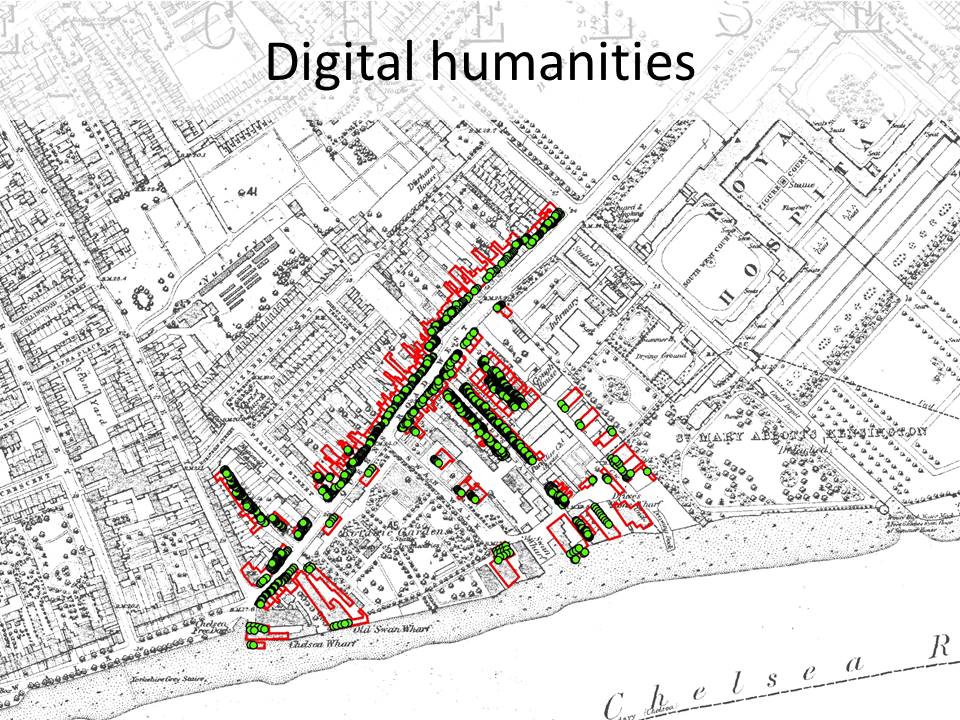
Slide 15: Digitised addresses and individual from the 1871 Census records over 1st Edition OS Map 1868 (Mapping from Digimap)
So, lets have a look at what happens when we pull all these perspectives and varied sources together. The base mapping in Slide 16 is the 1868 OS map, strangely published in 1874, by which time the Embankment was already built, so the landscape would have looked very different. The bright purple shapes and dots are the 1871 census records, with individual addresses and people shown. Additional things mapped here include Listed Buildings as orange squares – note that those located on the waterfront actually represent the post-embankment mansion houses. I’ve also mapped on here schools, churches, hospitals, public houses, green spaces, wharves, docks, piers and river stairs as recorded on all the maps from around this period. These are the multi-coloured shapes you can see inland of the river. The final addition to this map is the archaeological material. Here on the foreshore the lavender shapes are artefact scatters, the turquoise shapes are chalk barge beds, the green dots are timber posts and the brown dots finds. Their positions show how much of the foreshore was reclaimed as part of the Embankment construction.
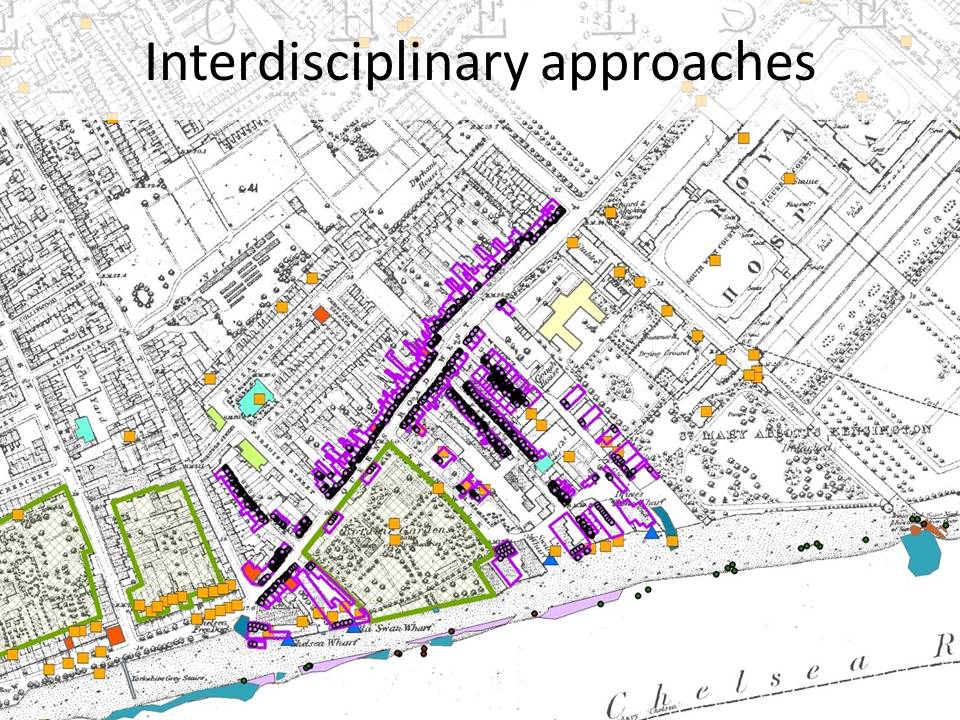
Slide 16: 1871 Census data, Listed buildings, features from historic mapping and archaeological features, over 1868 OS mapping.
So what does this piece of seeming abstract artistry tell us about Chelsea in the immediate pre-Embankment period?
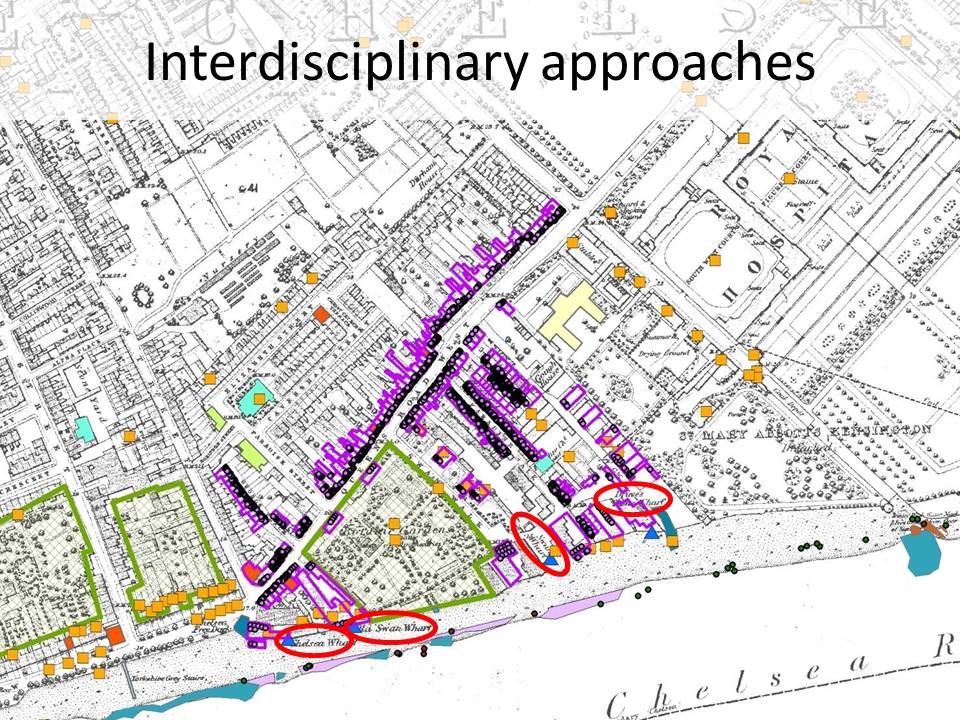
The population of the study area show in Slide 17 was 1608 individuals, of which 873 were women, around 54%. Around 36% of the population was aged 15 or under, although this includes 37 girls boarding in a ‘school of discipline’. Discounting these girls, 27% of the 10-15 year olds were in work, or with a listed occupation. Not surprisingly, we find these working children in the smaller, working class households of Queens Road West, George Place, Calthorpe Place, Bull Walk and the wharves, circled red in Slide 17. Of the total population 41% were born in Chelsea, just over half of whom were 15 or under. Two of the women were in their 80’s though! Just over one third of women over 15 did not work. Of those that were working just over a quater were either laundry women or ironers. Other major occupations included domestic service, or making clothes.
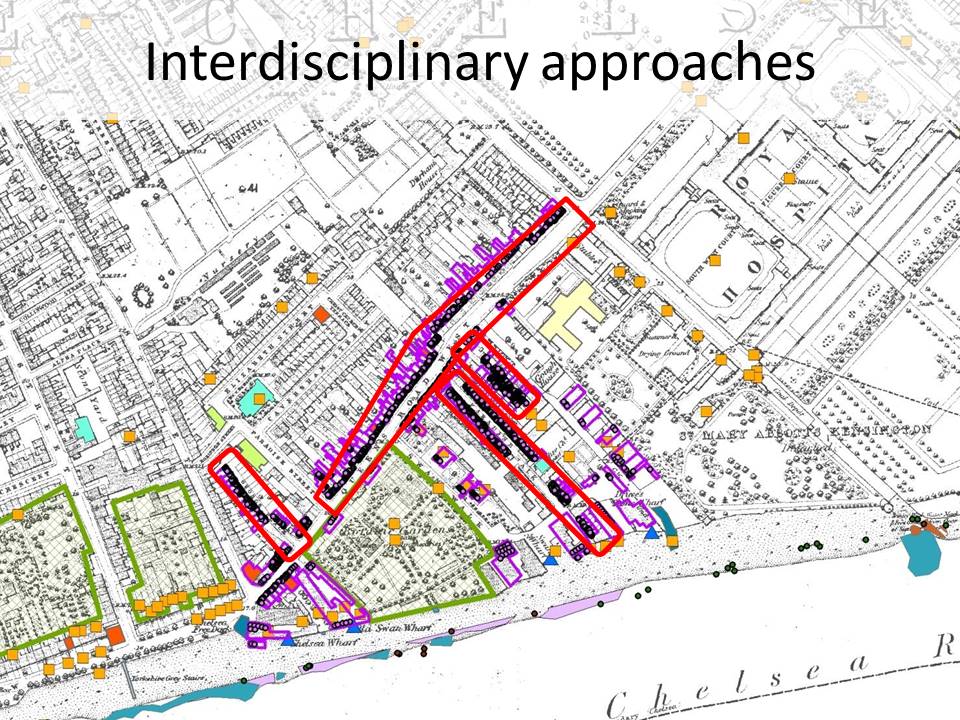
Slide 17: Chelsea in 1871 with Census data, historical and archaeological features mapped. Streets circled in red are the working class streets of Queens Road West, George Place, Calthorpe Place, Bull Walk.
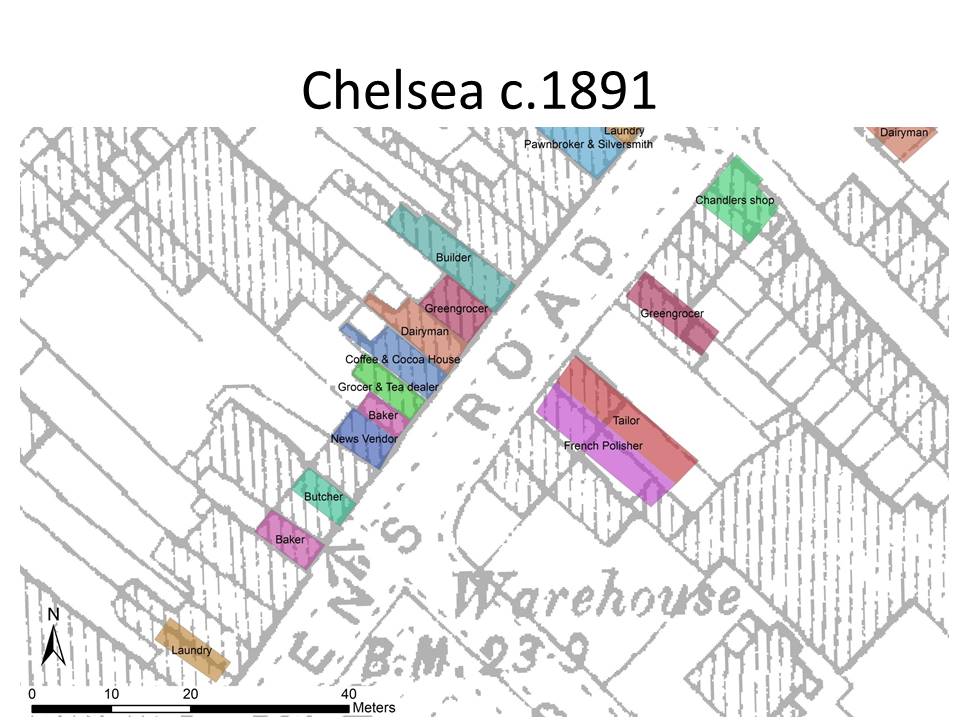
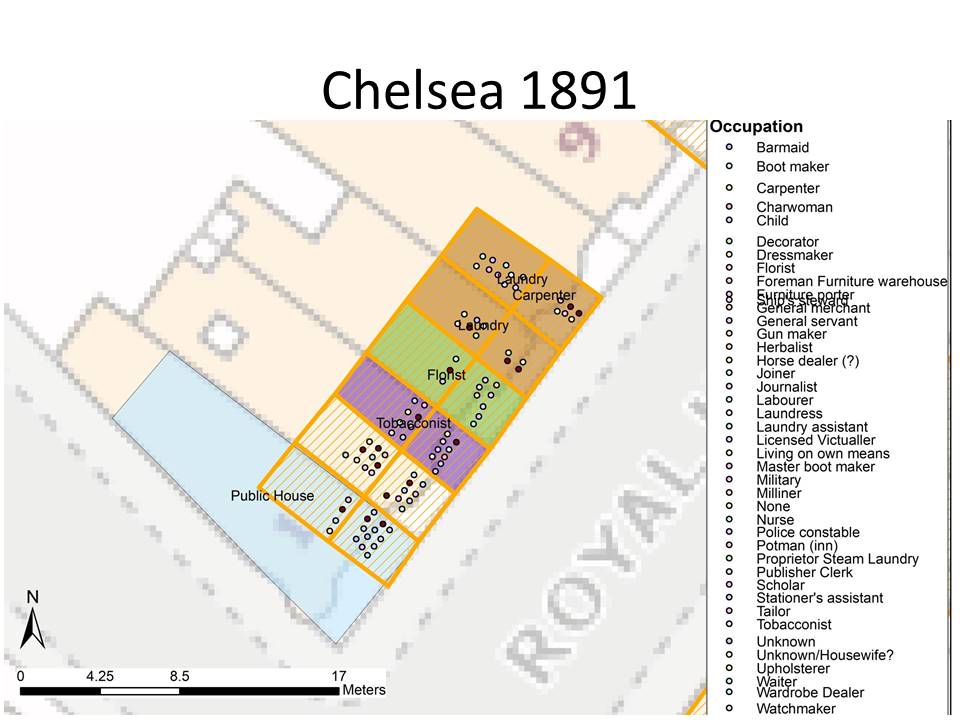
In addition to understanding the details of the population, the census, business directory, photographs and paintings show that the road circled in red in Slide 18, was the commercial centre of this community, with pubs, bakers, butchers, laundries and other businesses. Many of the owners, and workers, lived in the same building as the business, including apprentices and child workers.
Slide 18: Chelsea in 1871 with Census data, historical and archaeological features mapped. Area circled in red is the main commercial district, where the majority of shops and businesses were located in 1871.
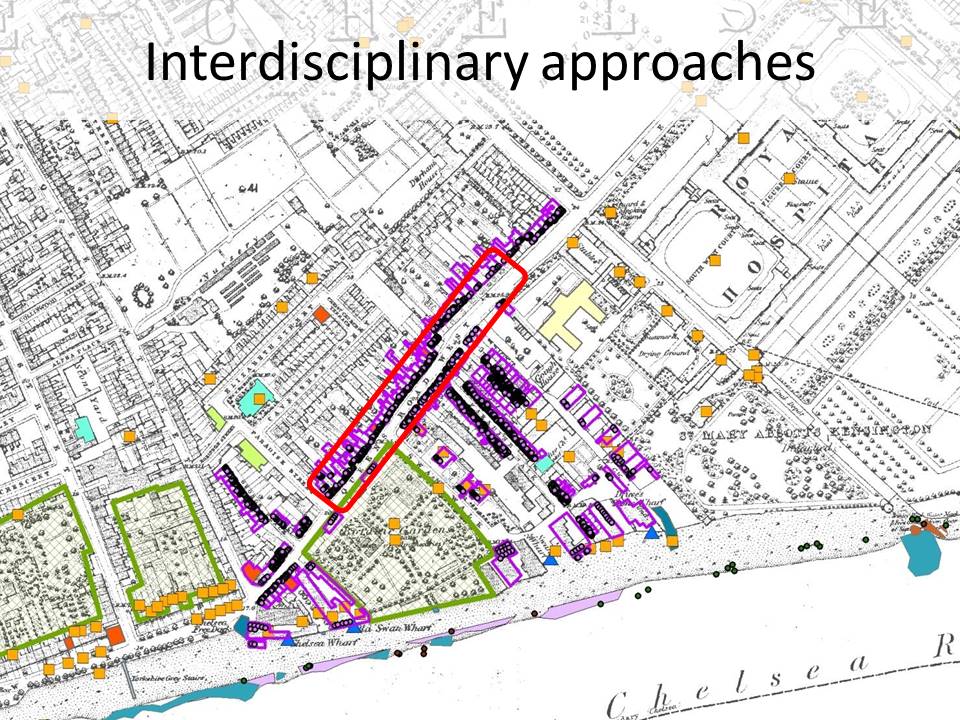
We can see that there are four wharves marked on the map (Slide 19) with associated artefact scatters and barge beds, and a further two, possibly three (Slide 20), identified in the Census records and archaeological material – Bull Wharf, Gough and Gough House Wharf. Within the Census records there are 37 people (all men) who worked on the river, some of whom worked locally, in occupations including bargemen, barge builder, wharf owners, clerks and managers, coal porters, labourers, lightermen and an apprentice, barge crew, steam boat stokers, watermen plus a retired waterman. There were 30 people living at wharf addresses, some of whom were wharf clerks and managers.
Slide 19: Chelsea in 1871 with Census data, historical and archaeological features mapped. Four wharves marked on the 1868 OS map are circled in red.
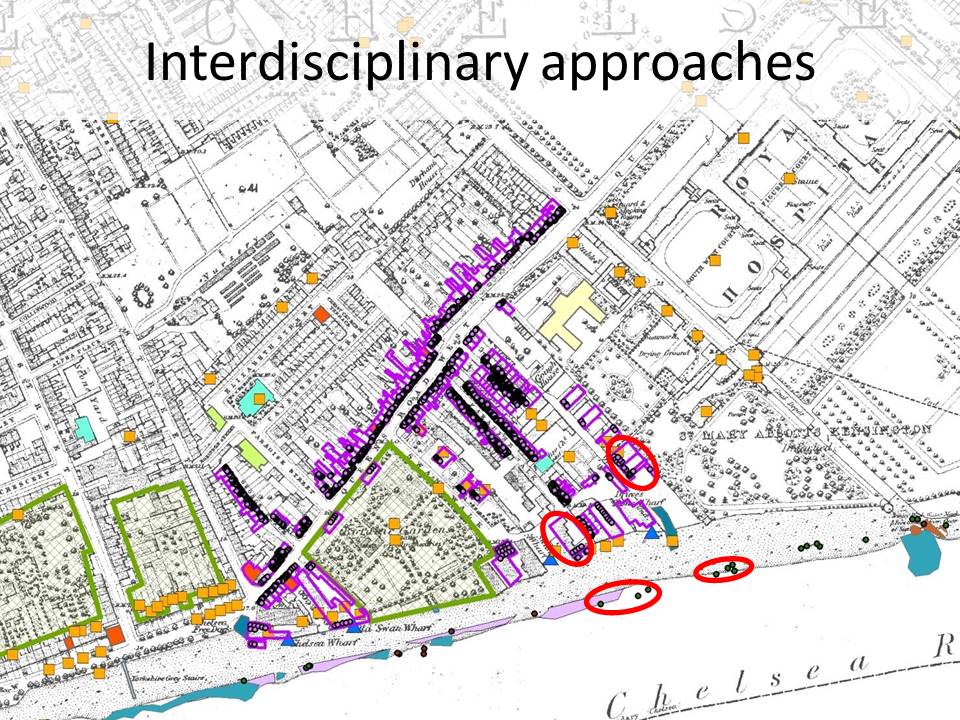
Slide 20: Chelsea in 1871 with Census data, historical and archaeological features mapped. Two additional wharves identified from census records and archaeological remains are circled in red.
The archaeological material also suggests that additional shipping activity was taking place immediately to the west, in the form of an extensive barge bed circled in red in Slide 21, which measures over 120m in length, which may be associated with the free dock or jetty associated with the Yorkshire Grey Stairs.
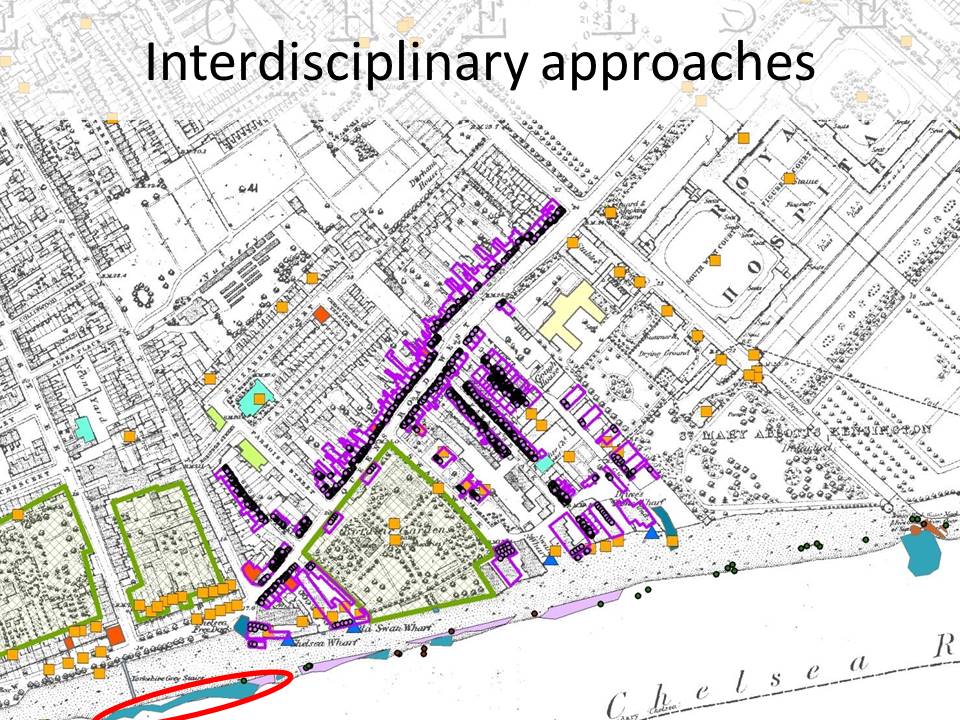
Slide 21: Chelsea in 1871 with Census data, historical and archaeological features mapped. A large barge bed identified on the foreshore is circled.
This vision of the Chelsea riverside in 1871, where over 1/3 of the population was under 15, a large proportion of the households belonged to the poorer working class, with numerous wharves and a fairly busy waterfront contrasts somewhat with the quiet, adult dominated, picturesque vision presented in the artistic impressions above, where most boats are pulled up on the foreshore, and only a few are obviously working vessels. Furthermore, it provides a vision of the waterfront beyond the traditional narrative of a stinking, sewage covered foreshore that needed improving and covering with the new Embankment. Taking an inter-disciplinary approach to this research has provided a more complex view of the social and economic landscape of pre-Embankment Chelsea, and offers the potential for very different stories to be told about the impacts and effects of the construction of the Thames Embankments.
References
Denny, B. 1996. Chelsea Past. London: Historical Publications Ltd.
Halliday, S. 2001. The Great Stink of London: Sir Joseph Bazalgette and the cleansing of the Victorian Metropolis. Stroud: Sutton Publishing Ltd.
Nead, L. 2000. Victorian Babylon. London: Yale University Press.
Oliver, S. 2000. The Thames Embankment and the Disciplining of Nature in Modernity. The Geographical Journal 166(3): p.227–238.
Owen, D. 1982. Victorian London 1855-1889: The Metropolitain Board of Works, the Vestries and the City Corporation. London: The Belknap Press of Harvard University Press.
Picard, L. 2005. Victorian London: Life of a city 1840-1870. London: Orion Books Ltd.
Porter, D.H. 1998. The Thames Embankment. Environment, Technology and Society in Victorian London. The University of Akron Press.
Porter, R. 1994. London: A Social History 3rd ed. London: Penguin Books.
Richardson, J. 2003. The Chelsea Book: past and present. London: Historical Publications Ltd.
Werner, A., & Williams, T. 2011. Dickens’s Victorian London 1839-1901. London: Ebury Press.
White, J. 2008. London in the 19th Century. London: Vintage Books.